•Similar to the Filter Elements described earlier, the Range Filter is a specialized, interactive dashboard item that allows the user to apply filtering to the other items on the dashboard.
•The Range Filter appears as a chart with selection thumbs that allow the user to filter out values displayed along the argument axis. In our example, we are going to add a Range Filter that will filter Net Income by Item Date, so that the user can drag-and-drop the selection thumbs to indicate a date range, causing the other Dashboard Items to display the Net Income generated by Items that fall within those dates.
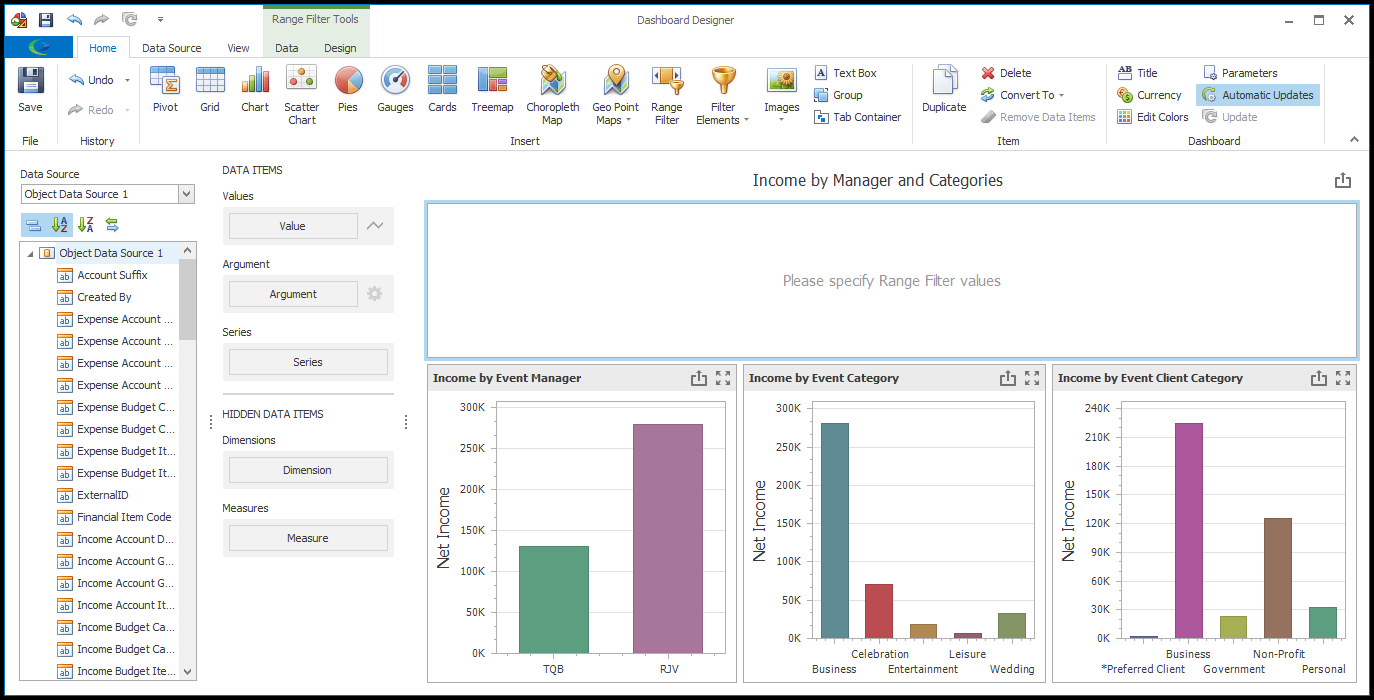
1.In the Dashboard Designer, click the Range Filter button.
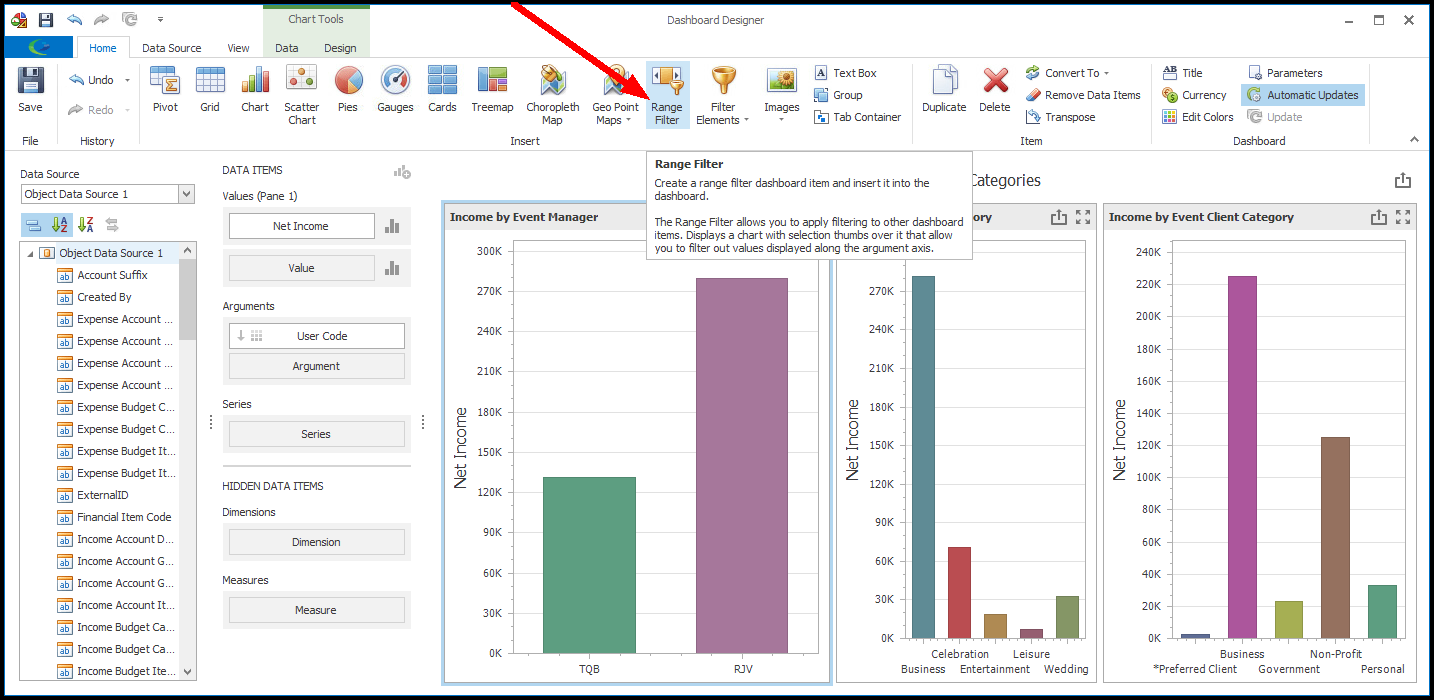
2.A blank Range Filter item appears on the design surface. Re-position the item as necessary.
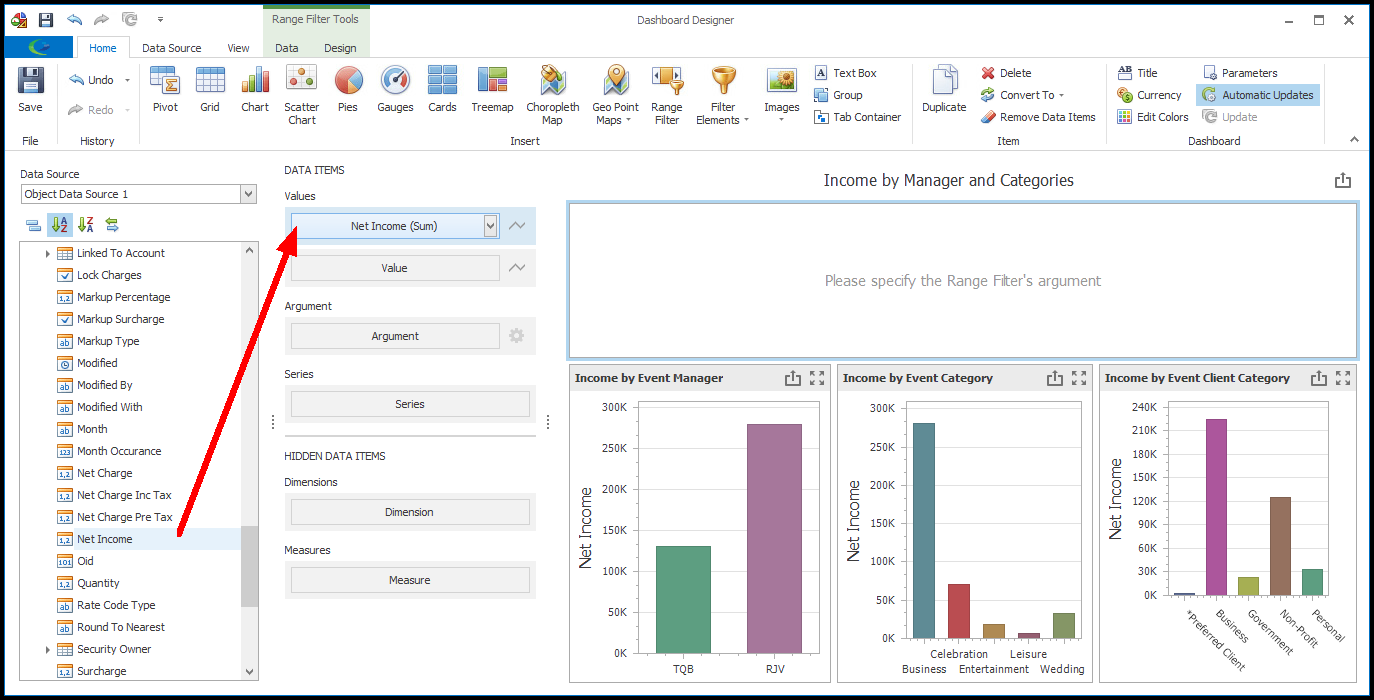
3.From the Data Source Browser in the left column, find the fields you want to use to provide filter values. In our example, we are using Net Income as the Value, and Item Date as the Argument.
4.First, drag and drop the Net Income field onto the Value data item under DATA ITEMS.
5.Next, drag and drop the Item Date field onto the Argument data item under DATA ITEMS.
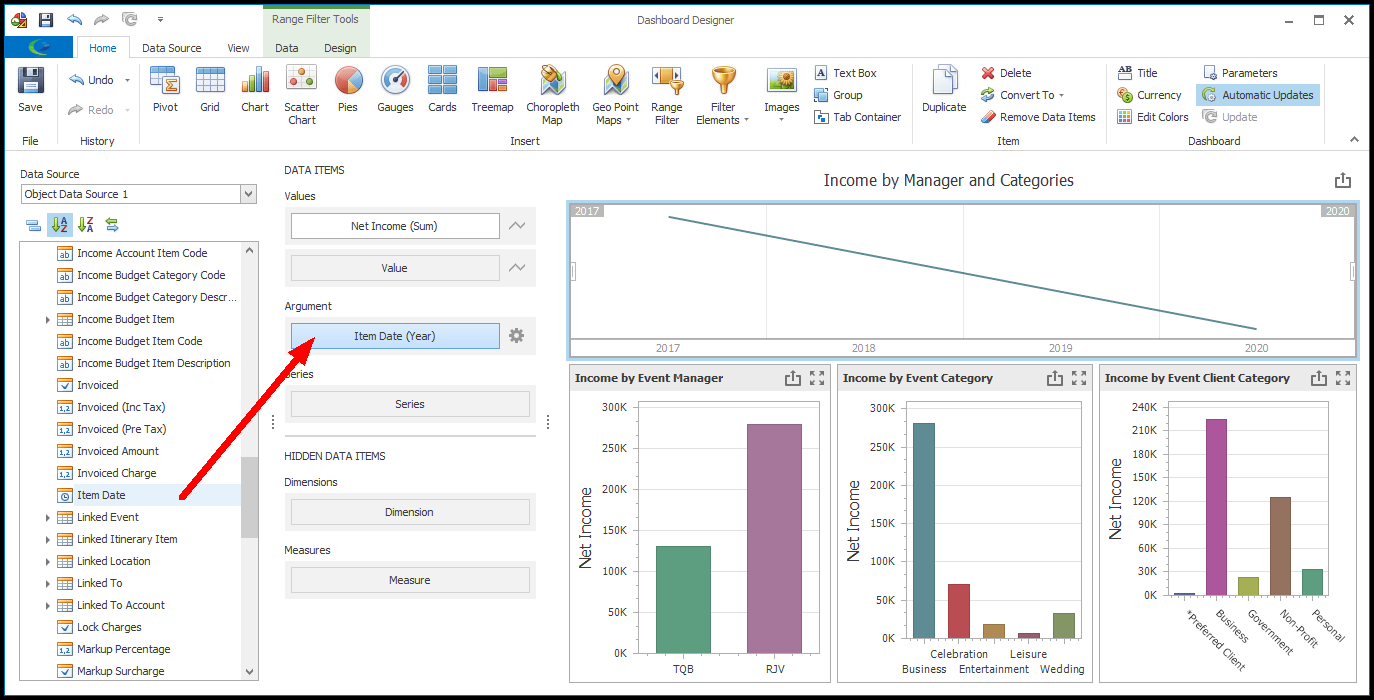
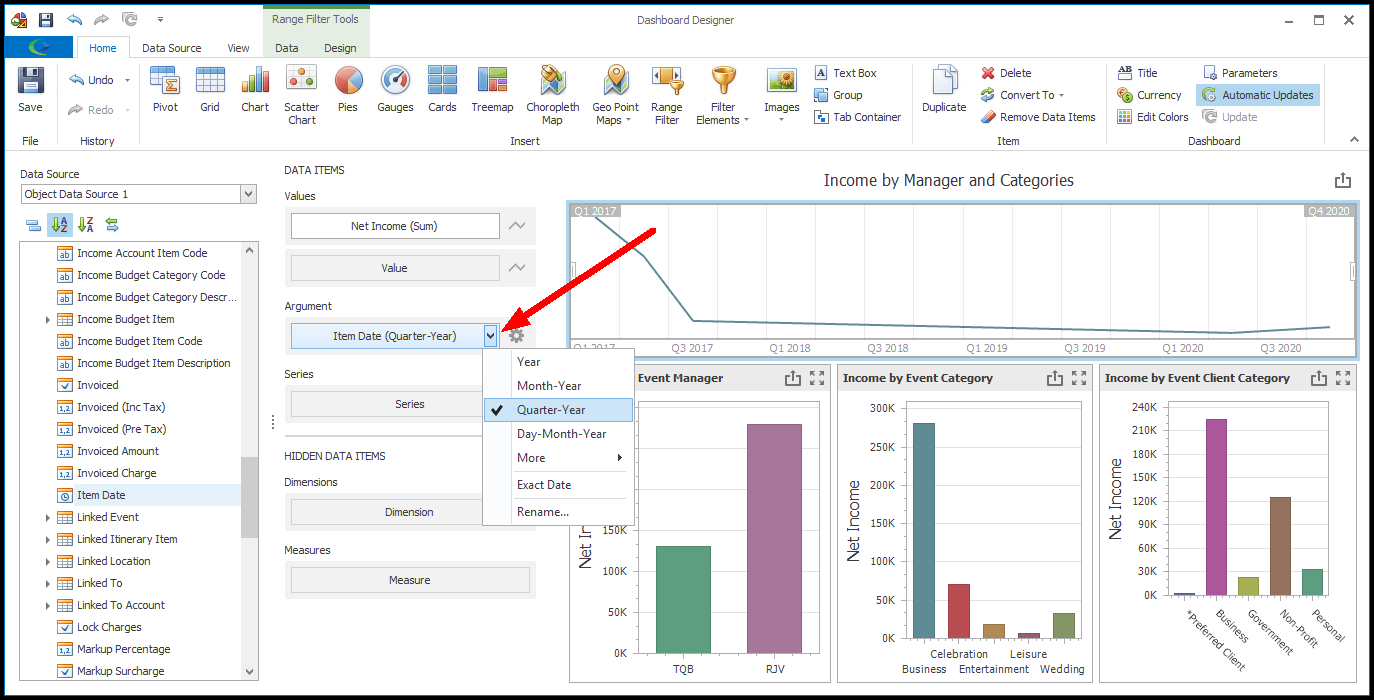
a.By default, the Item Date will be grouped by the Year interval. In our example, we want to group the Item Date by Quarter-Year. Click the Item Date's drop-down menu button (the small arrow on the right) and select the Quarter-Year group interval.
6.When you are done designing the Range Filter, it's usually a good idea to Save your dashboard.
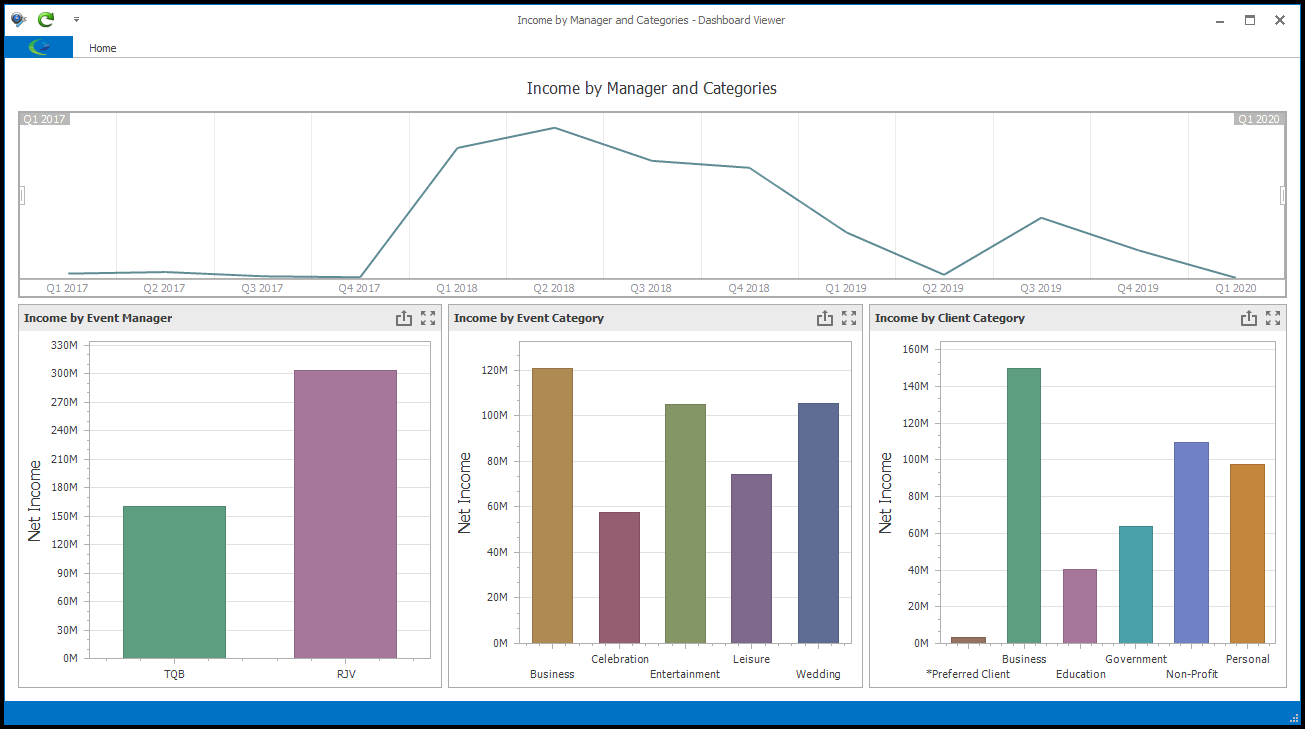
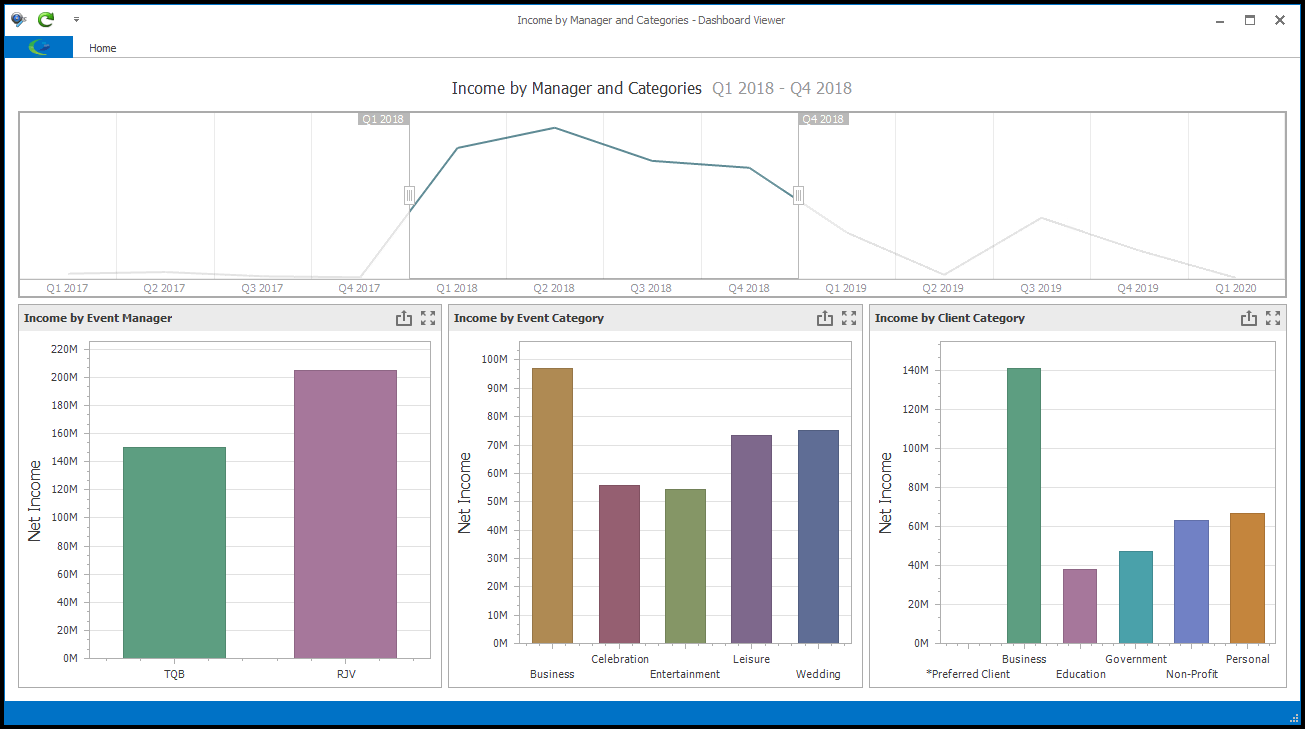
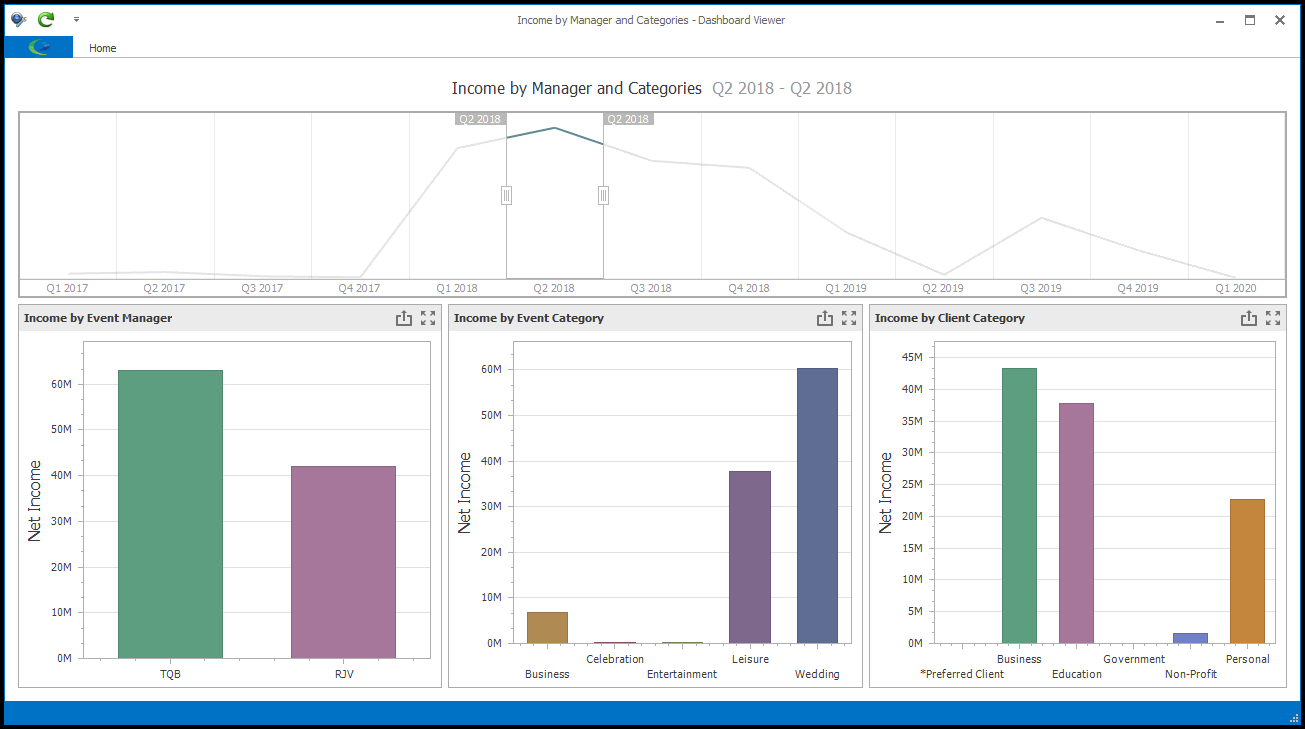
7.Later, when viewing the dashboard, a user will be able to use the selection thumbs of the Range Filter to filter the other Dashboard Items.