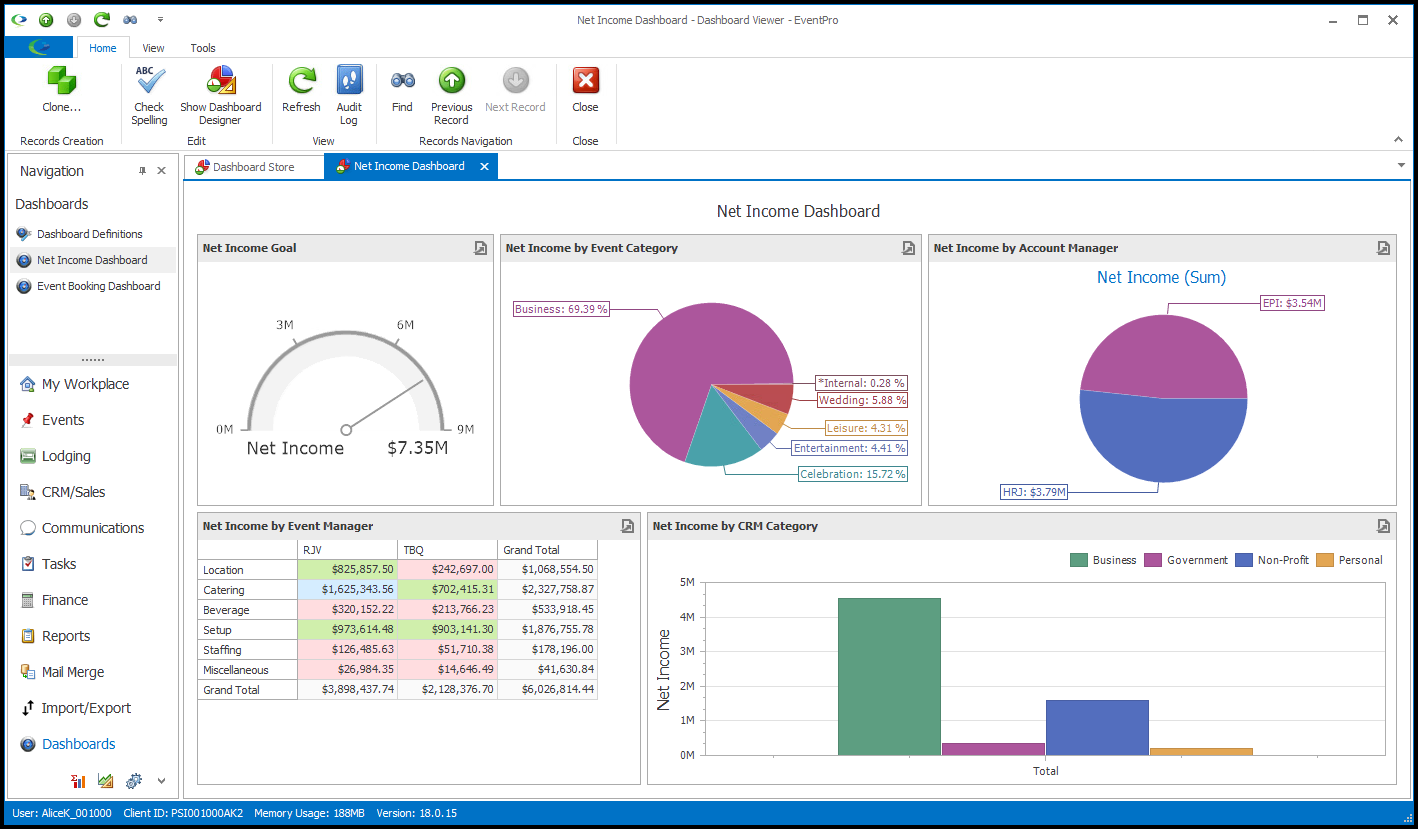
•A Dashboard is a collection of interactive elements that visualize data in real time. The purpose of a Dashboard is to provide up-to-date critical information summarized in easy-to-understand visual components.
•With EventPro's Dashboard module, you can define multiple Dashboards, and each Dashboard can contain multiple visual elements, including charts, grids, pies, gauges, cards, pivot tables, and more.

•If you are ready to begin defining your Dashboards, follow the instructions below:
oAdd Filter Element (Combo Box/List Box/Tree View)
•If you have worked in the Dashboard Designer before, you may have noticed some changes since the release of EventPro 18. To review those changes, see New Dashboard Features.