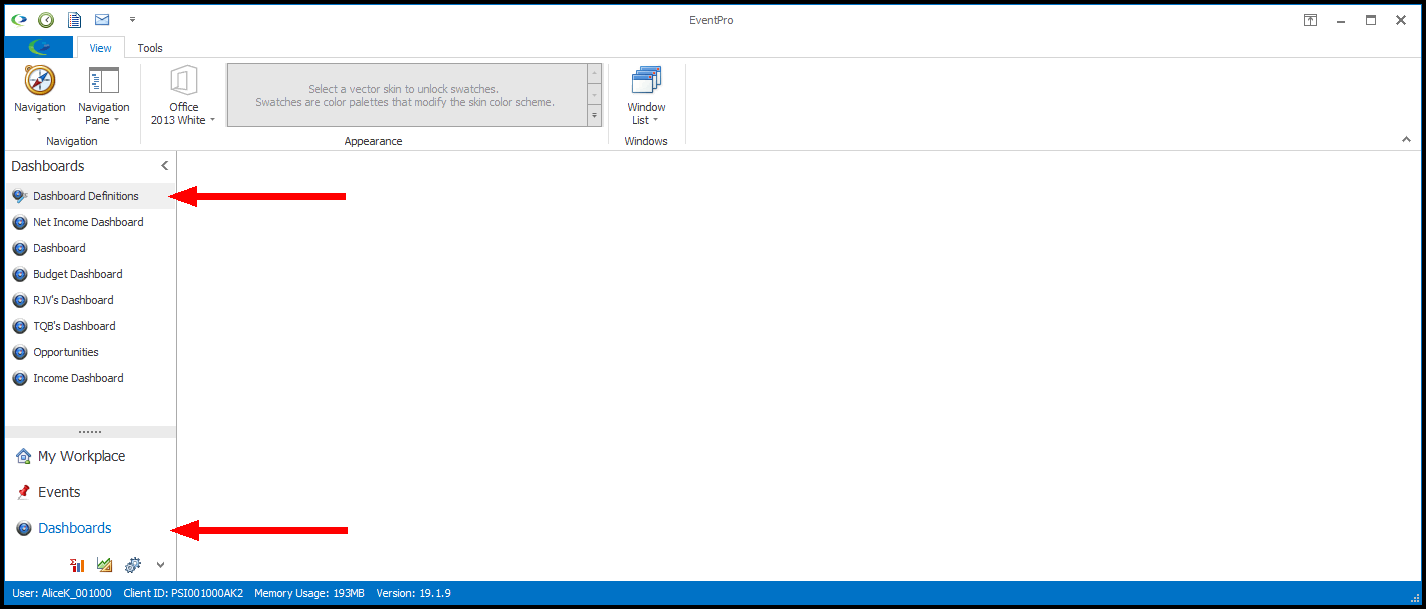
1.Navigate to the Dashboards > Dashboard Definitions area using the navigation panel or navigation menu.
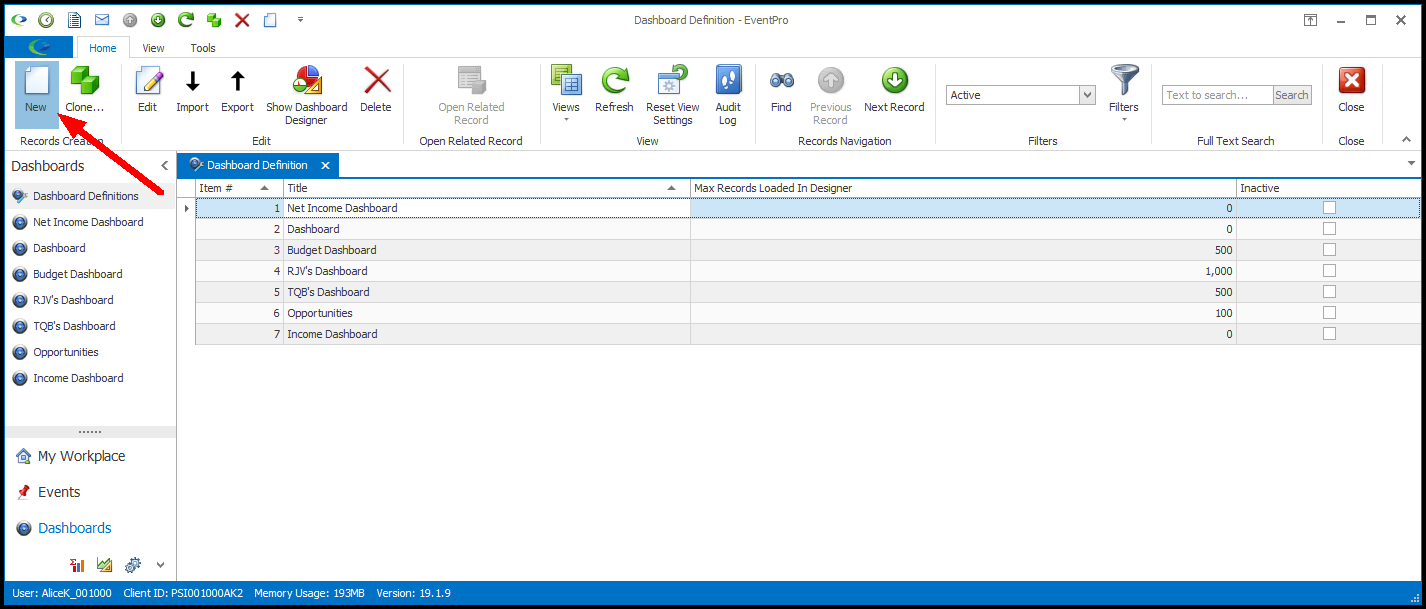
2.Start a new Dashboard by clicking the New button in the top ribbon.
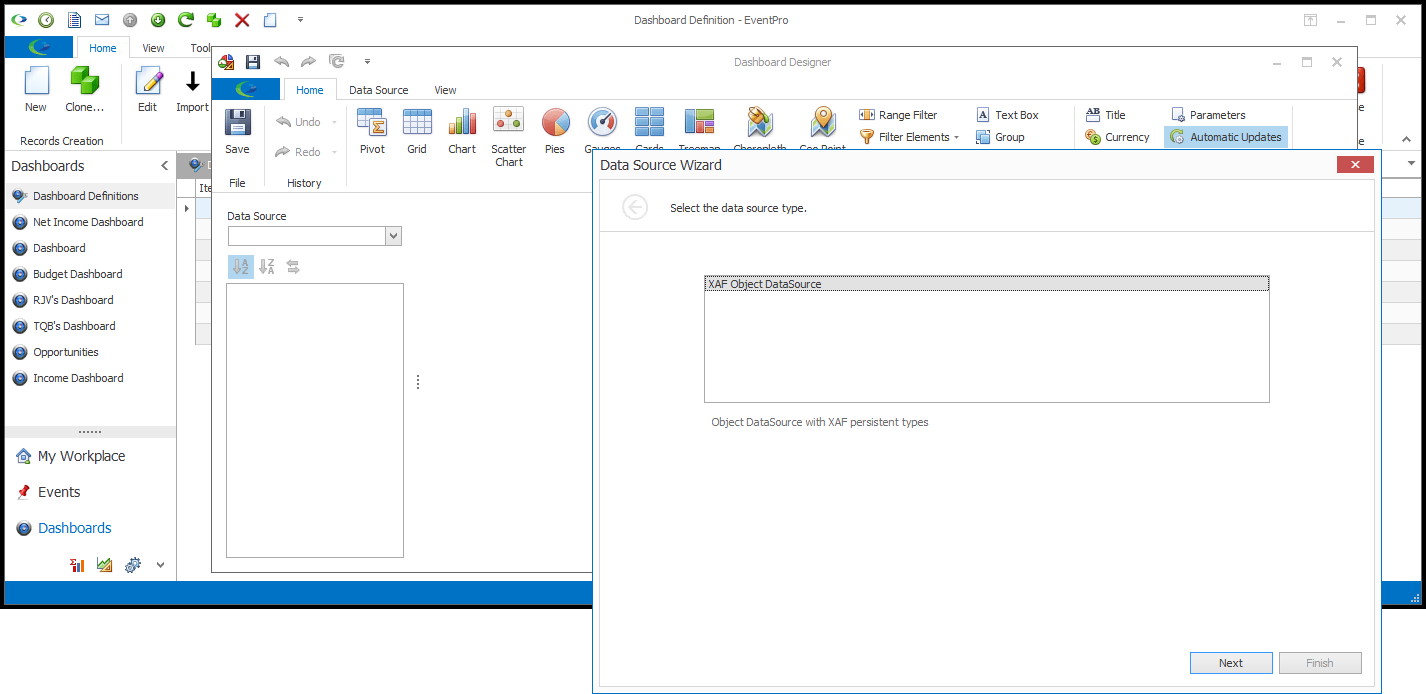
3.The Data Source Wizard begins.
Select the Data Source Type (currently only XAF Object DataSource is available), and click Next.
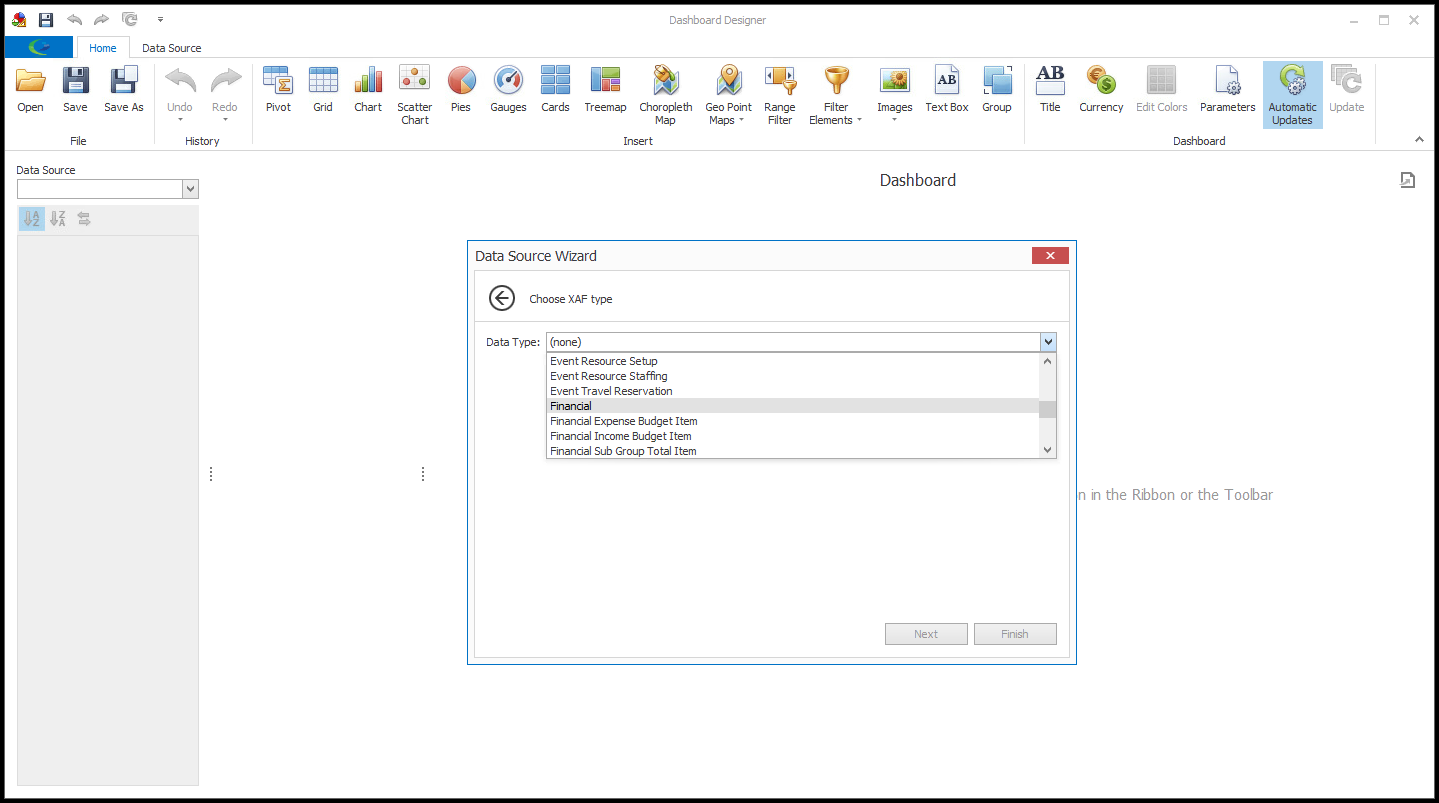
4.Select a Data Type from the drop-down.
In our example, we are going to select Financial. (You will be able to add other Data Sources to the Dashboard later in the Designer.)
Click Next.
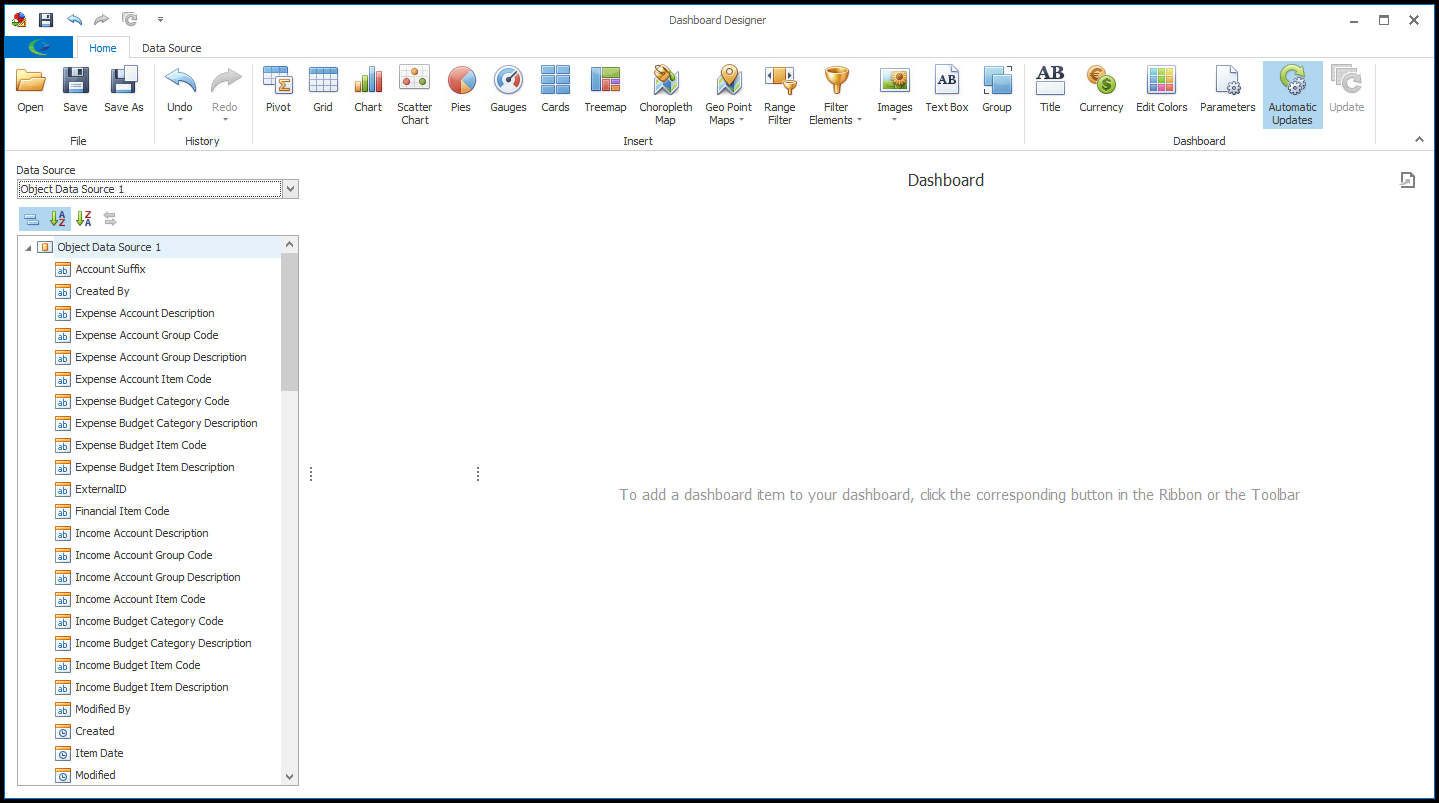
5.The Dashboard Designer opens.
When you first create a Dashboard, the Dashboard Designer space will be blank.
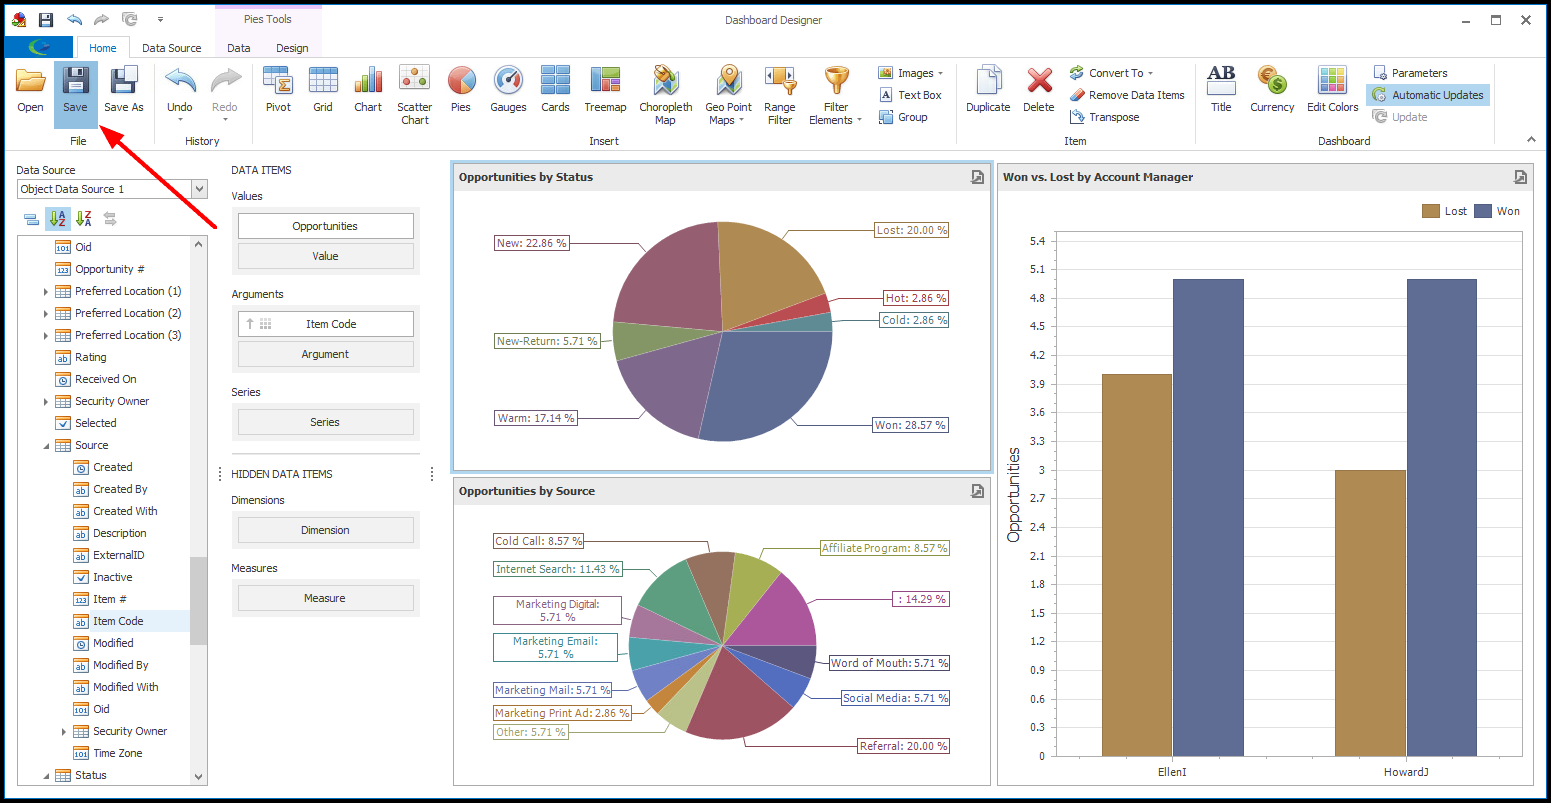
6.In the Dashboard Designer, you will add the visual data items you want in this Dashboard.
See the instructions under Design Dashboard.
7.When you are done designing your new Dashboard, click the Save button in the Dashboard Designer.
Then click the "x" in the upper right corner to close the Dashboard Designer window.
8.The new Dashboard will appear in the Dashboard Viewer.
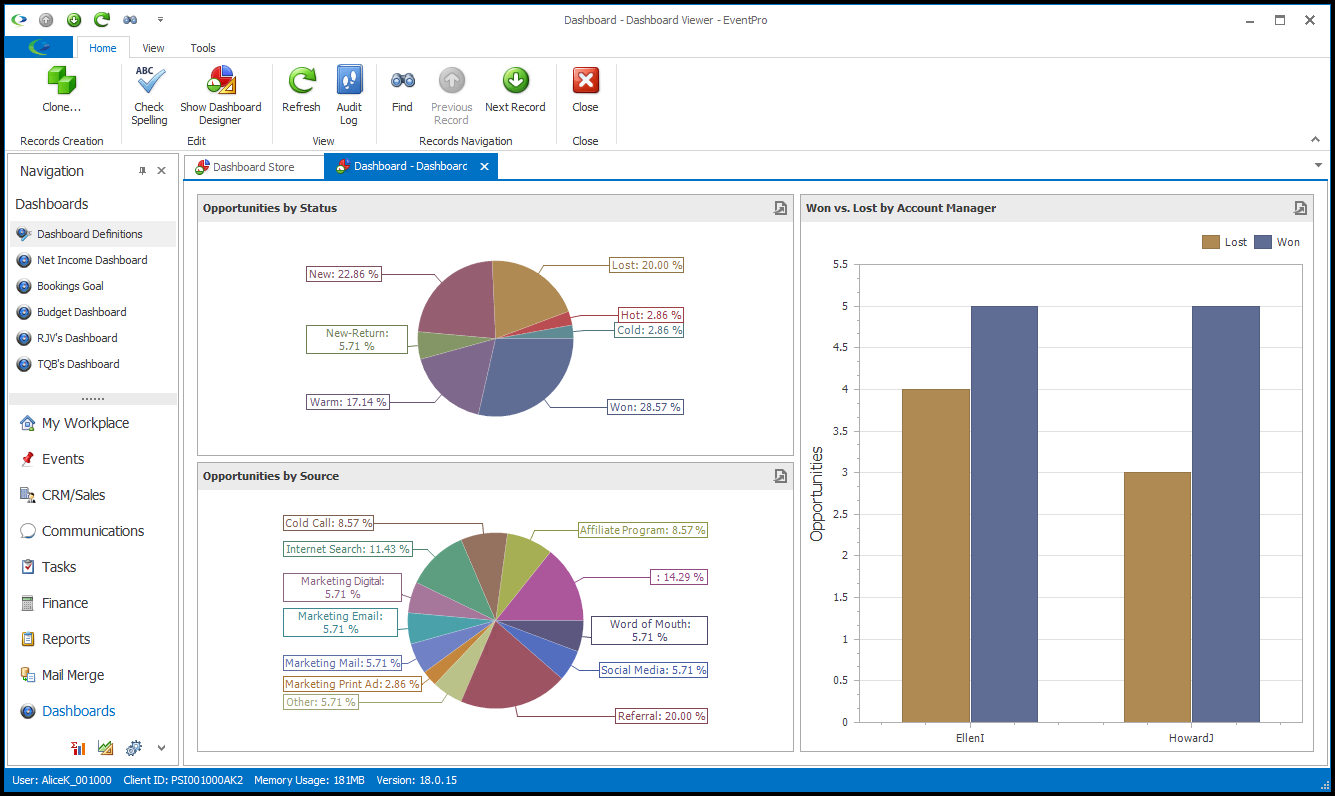
Note that the Viewer will automatically open after exiting the Designer only when you've just created a new Dashboard. When you edit existing Dashboards in the Designer, the Viewer will not automatically open when you save and exit the Designer.
9.Click Close to close the Dashboard Viewer.
10.Back in the Dashboard Definitions area, you will notice that your newly created Dashboard has been saved under the Title you assigned to the Dashboard in the Designer.
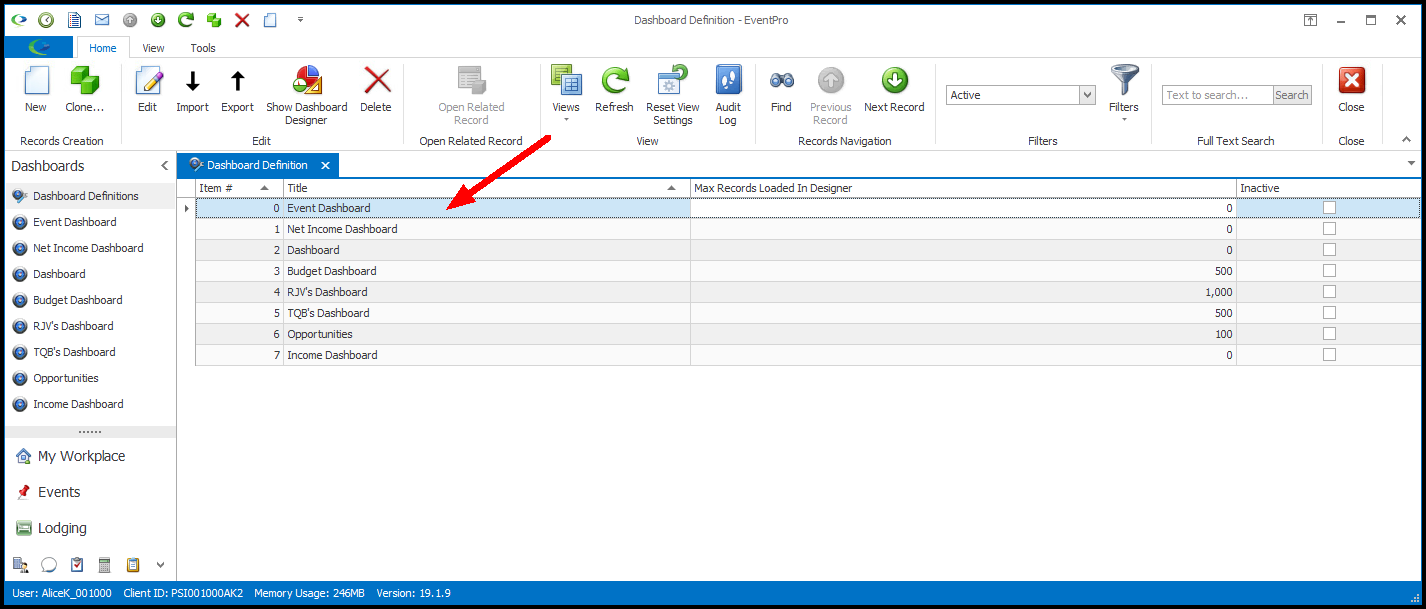
11.To re-title the Dashboard and change the Max Records Loaded in Designer setting, you can edit the Dashboard Store record.
See Edit Dashboard Store.
12.To change the visual data elements within the Dashboard, you need to return to the Dashboard Designer. See Design Dashboard.