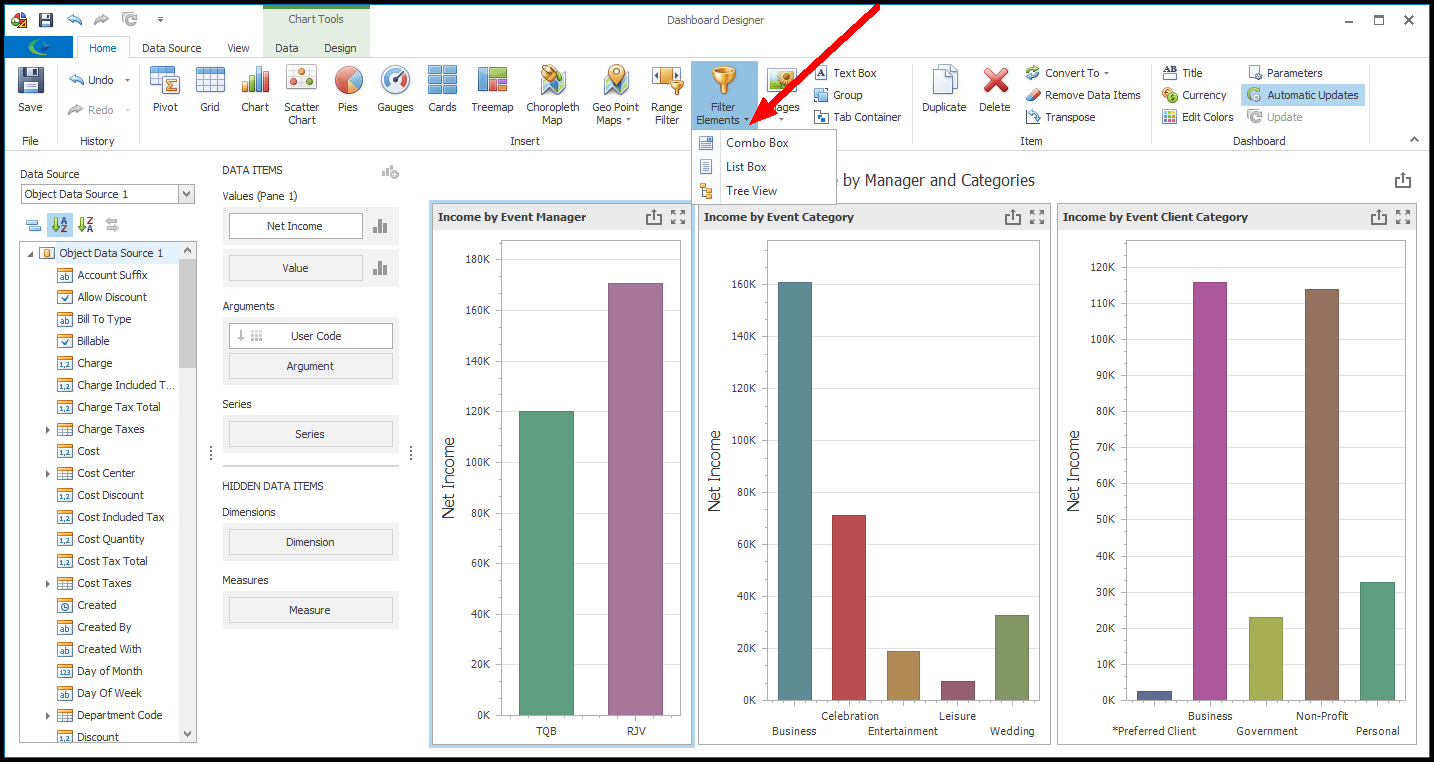
1.To add a Tree View to your dashboard, click the Filter Element button in the Dashboard Designer and select Tree View.
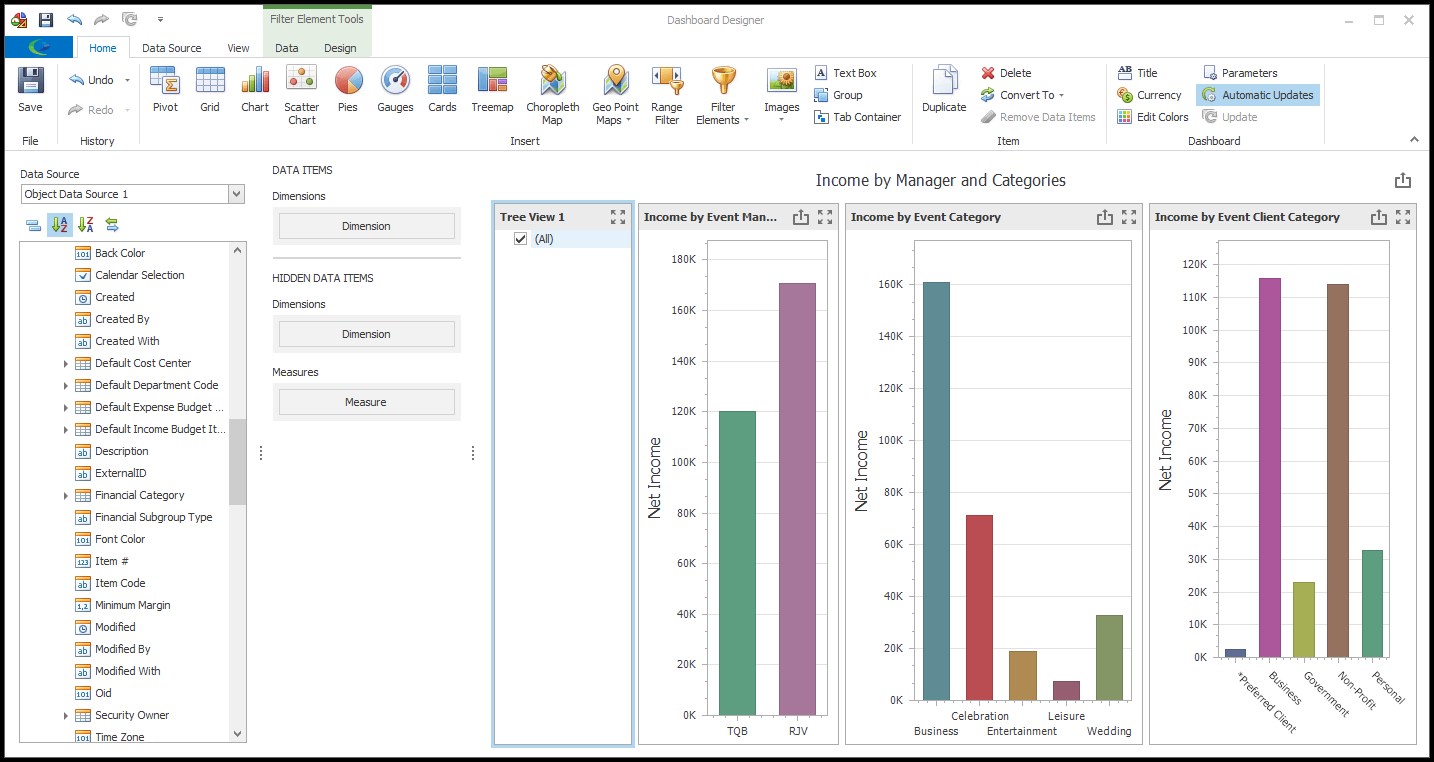
2.A blank Tree View item will appear in the Dashboard Designer.
3.From the Data Source Browser in the left column, find the field you want to use to provide filter values. In our example, we will be using the Item Date.
4.First, drag and drop the Item Date field onto the Dimensions data item under DATA ITEMS.
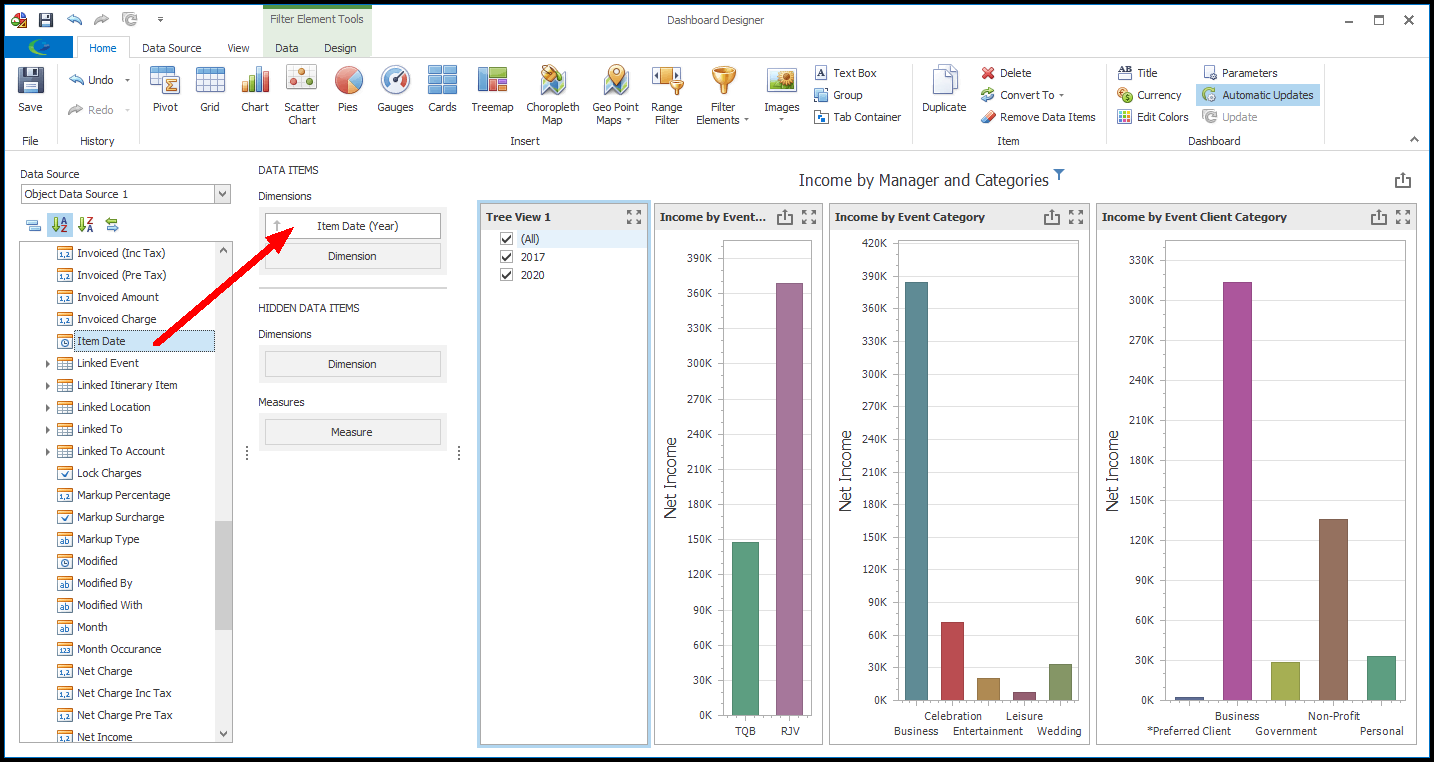
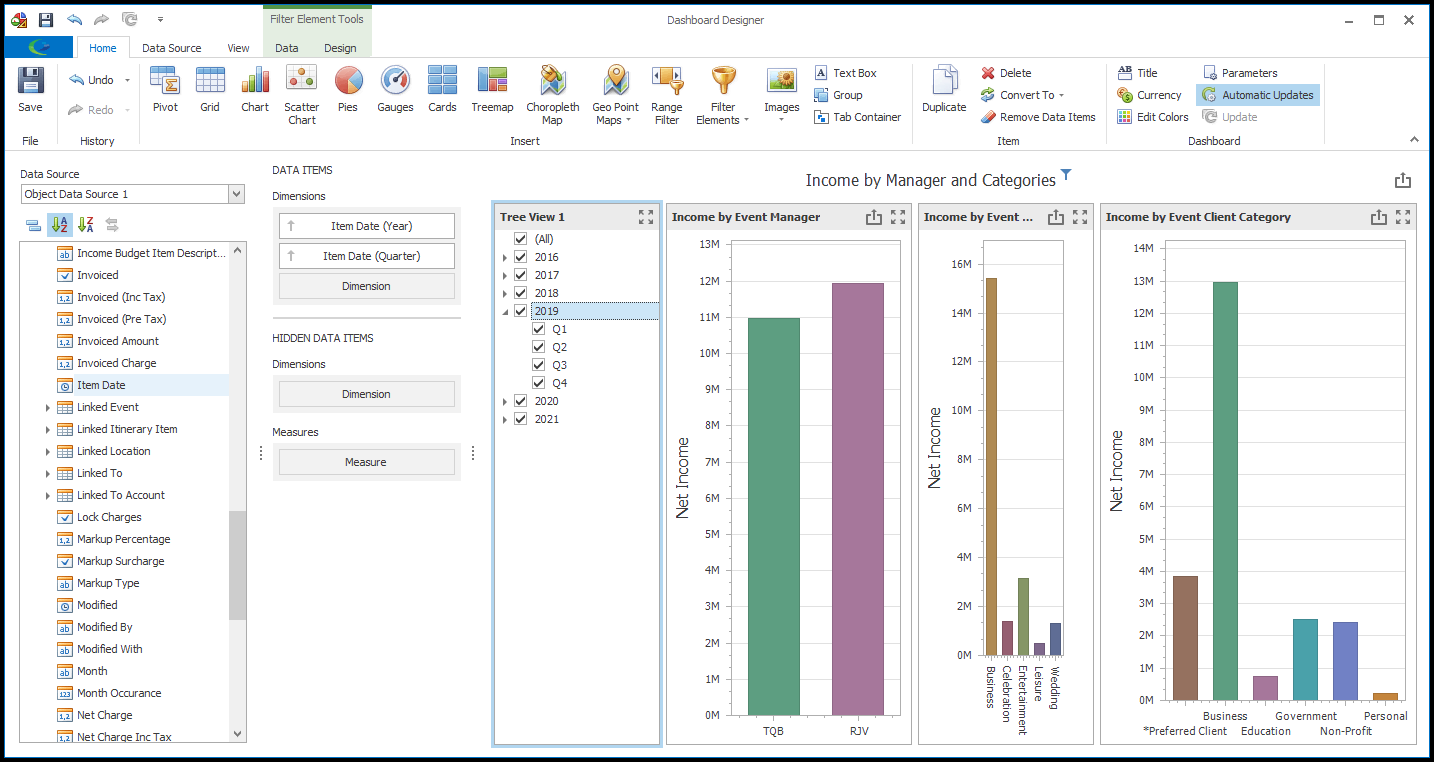
5.By default, the Item Date will be grouped by the Year interval, which is how we will leave it. (You could change it to an interval that grouped Item Date by Month-Year or Quarter-Year, but instead, we are going to add the Quarter and Month as additional dimensions to create a tree view.)
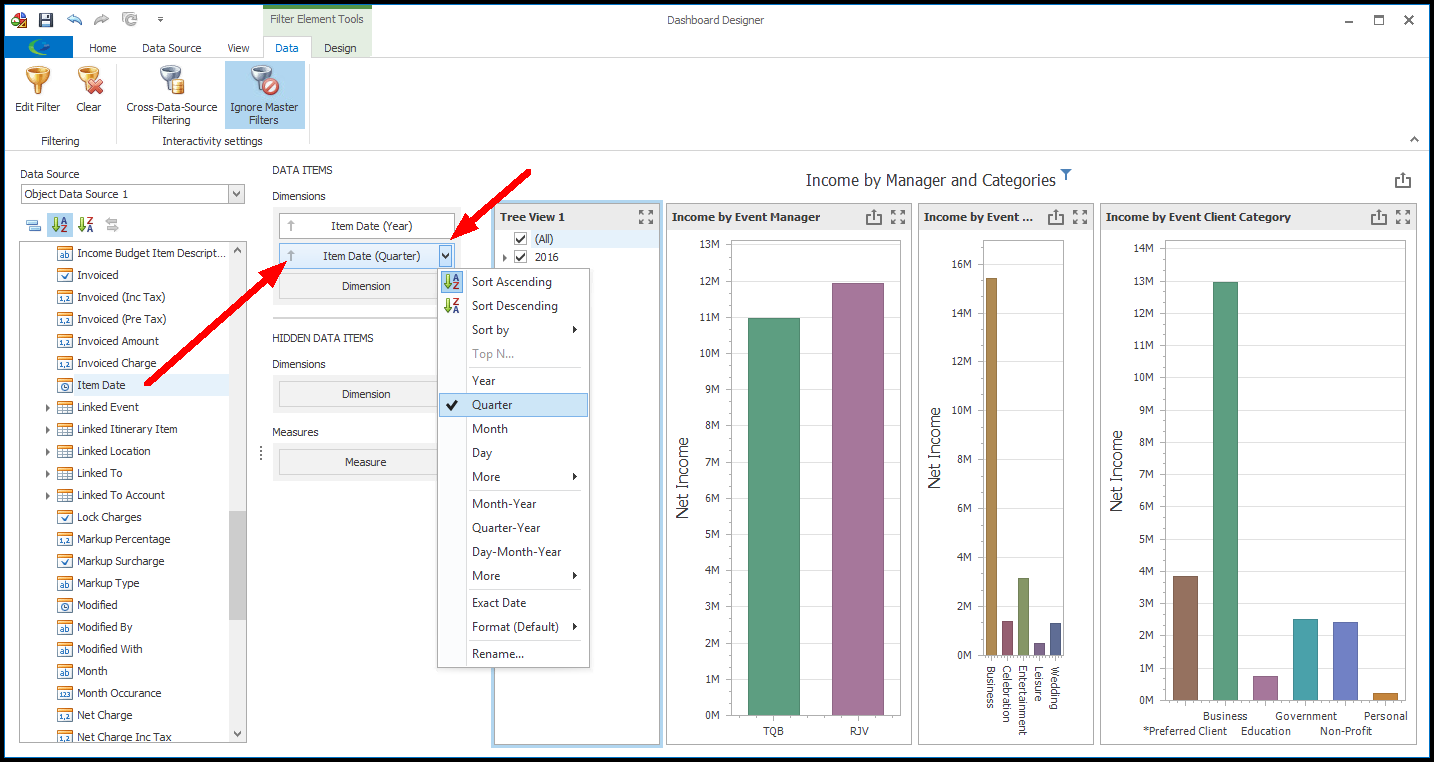
6.We will now drag and drop the Item Date field onto the second Dimensions data item container. This time, click the Item Date's drop-down menu button (the small arrow on the right) and select the Quarter group interval. In the Tree View, you will notice that Quarters now appear under the Years.
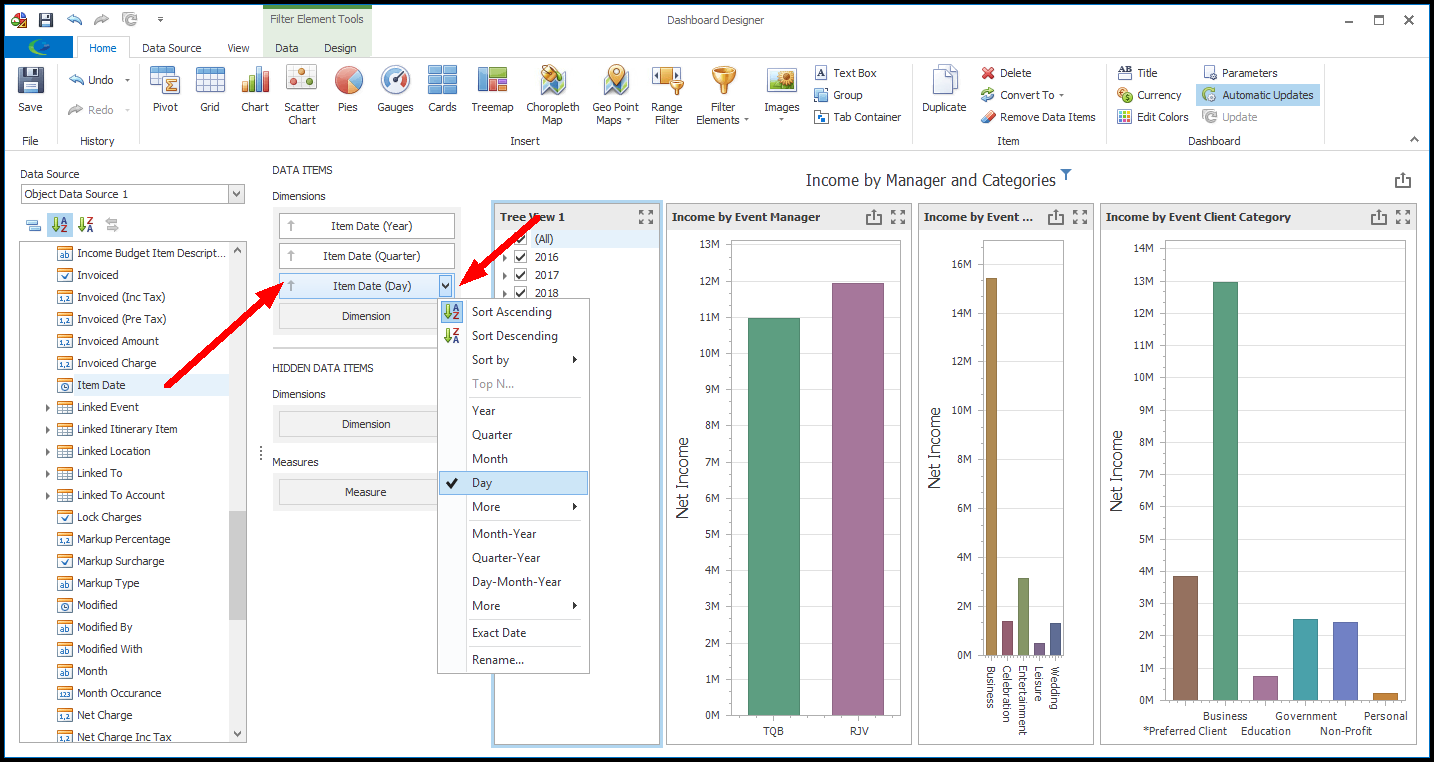
7.Finally, one last time, we will drag and drop the Item Date field onto the third Dimensions data item container. This time, change the Item Date's group interval to Month. In the Tree View, you will notice that Months now appear under the Quarters.
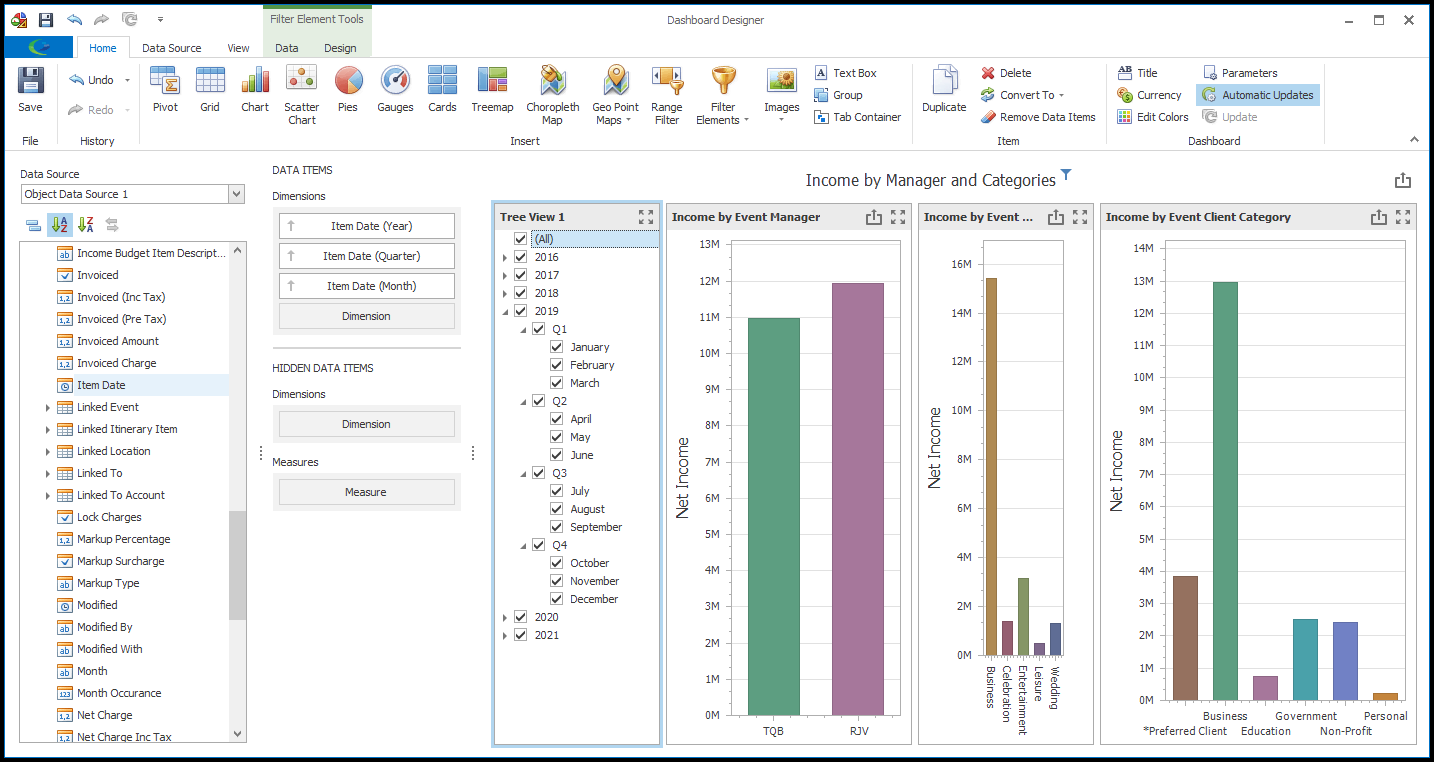
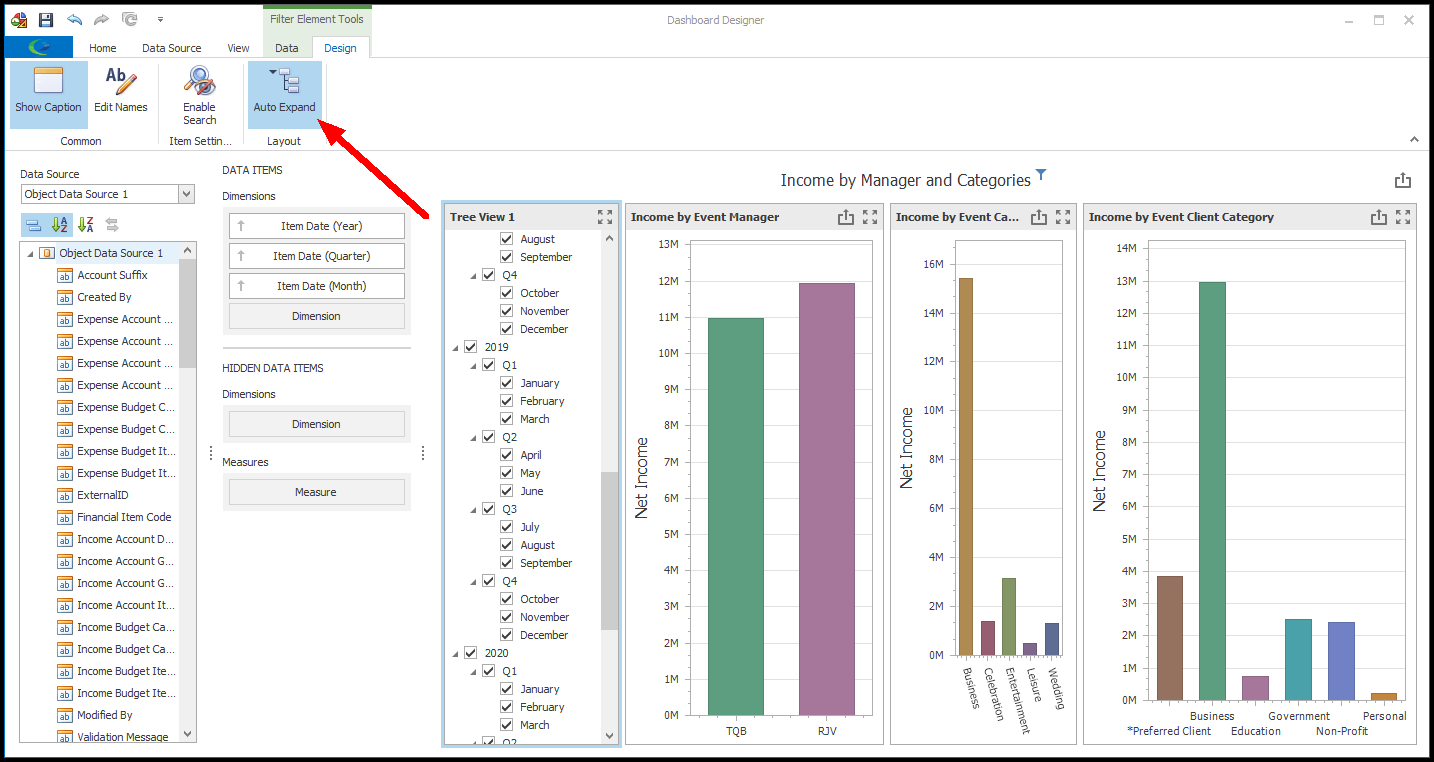
8.Initially, the nodes of the tree view will be collapsed. If you want the tree view nodes to be expanded on initial view, click the Auto Expand toggle button under the Design ribbon.
9.As with other dashboard items, you may want to change the caption of the Tree View item to something more useful. Review Design Dashboard > Design Dashboard Item above.
10.When you are done designing the Tree View Filter Element, it's usually a good idea to Save your dashboard.
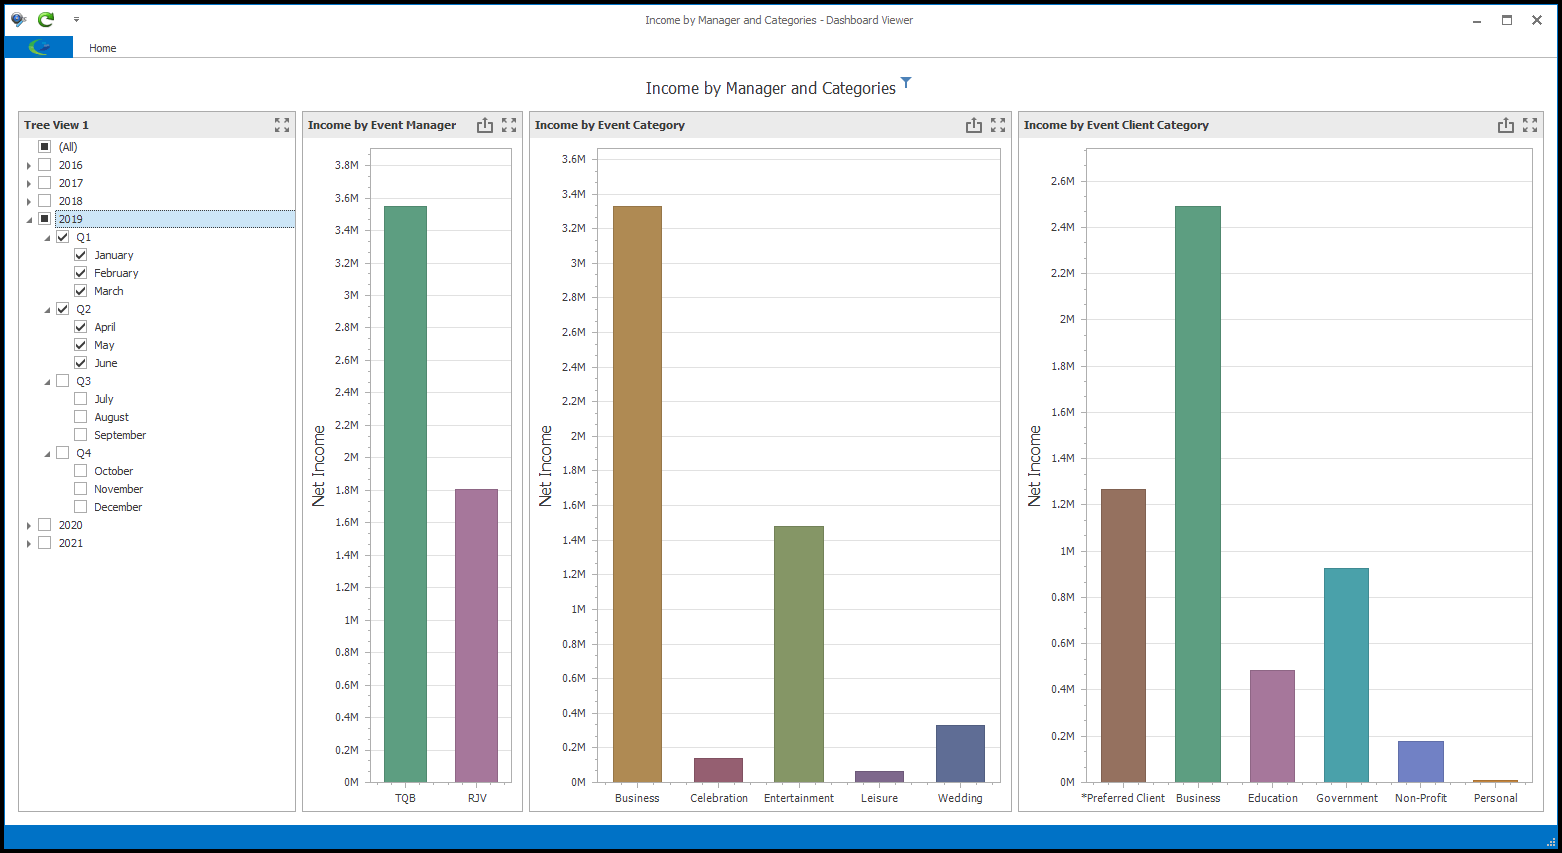
11.Later, when viewing the dashboard, a user will be able to use the tree view checkboxes to filter the displayed information.