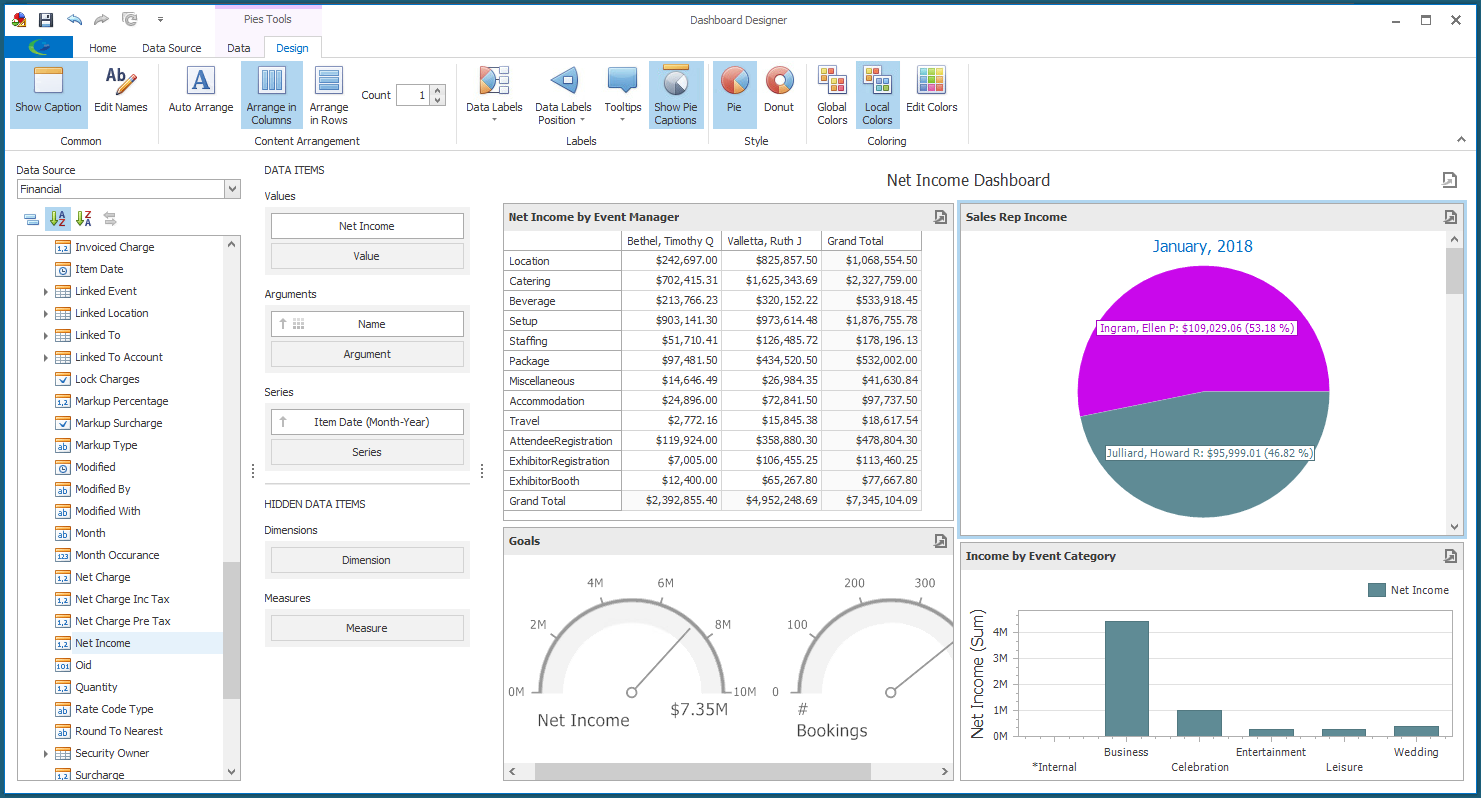
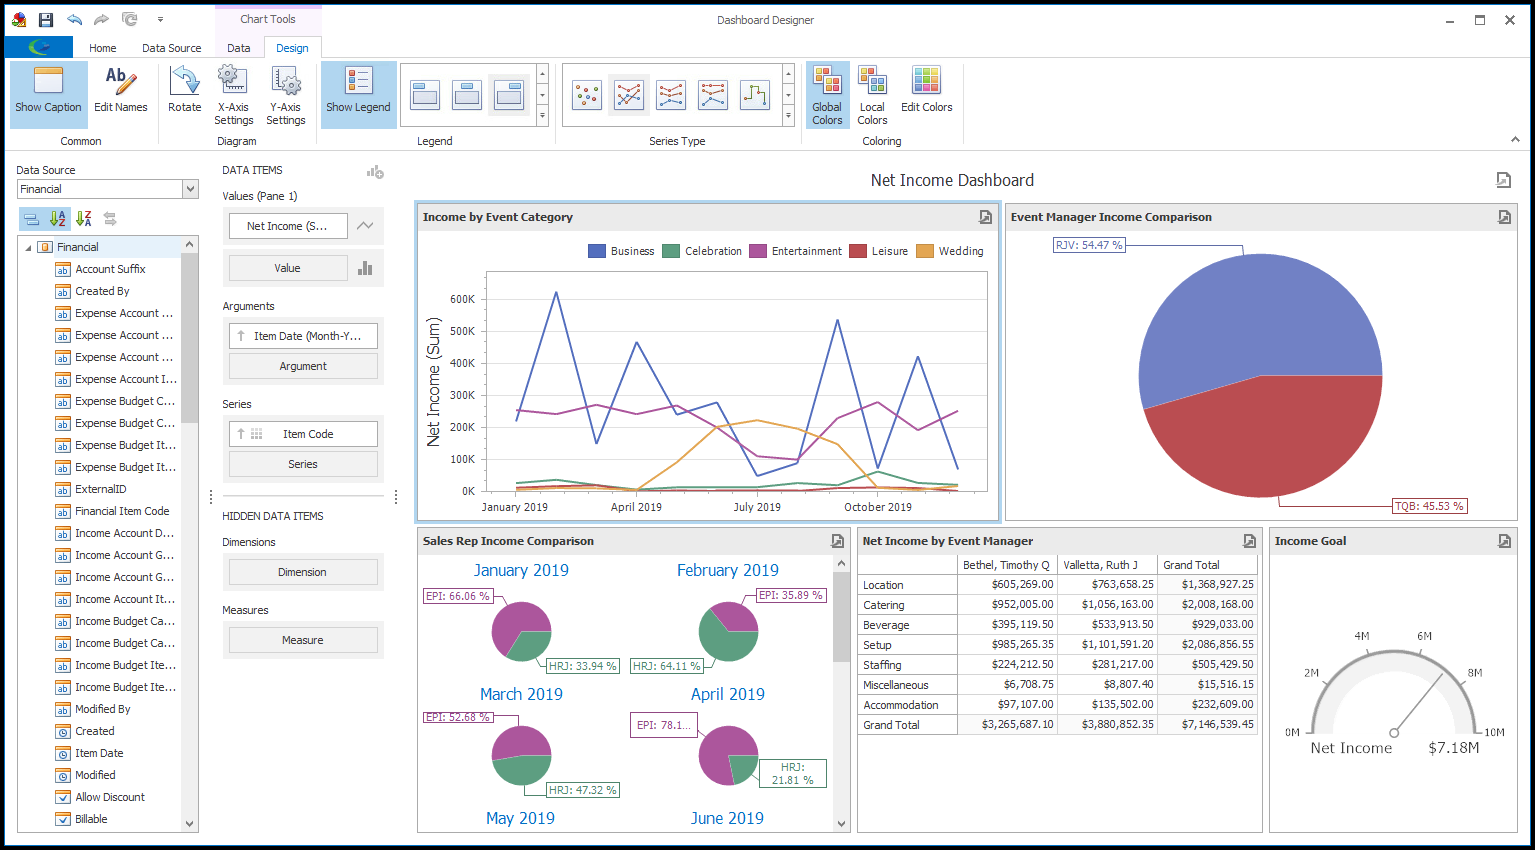
1.Tools for designing the currently selected Dashboard Item are contained under the Design tab of the top ribbon.
2.The Design Tools available for Dashboard Items will vary, depending on the selected Dashboard Item's Type, although all Types will have the Show Caption and Edit Names commands.
a.Example of Design Tools for a Pie:
b.Example of Design Tools for a Chart:
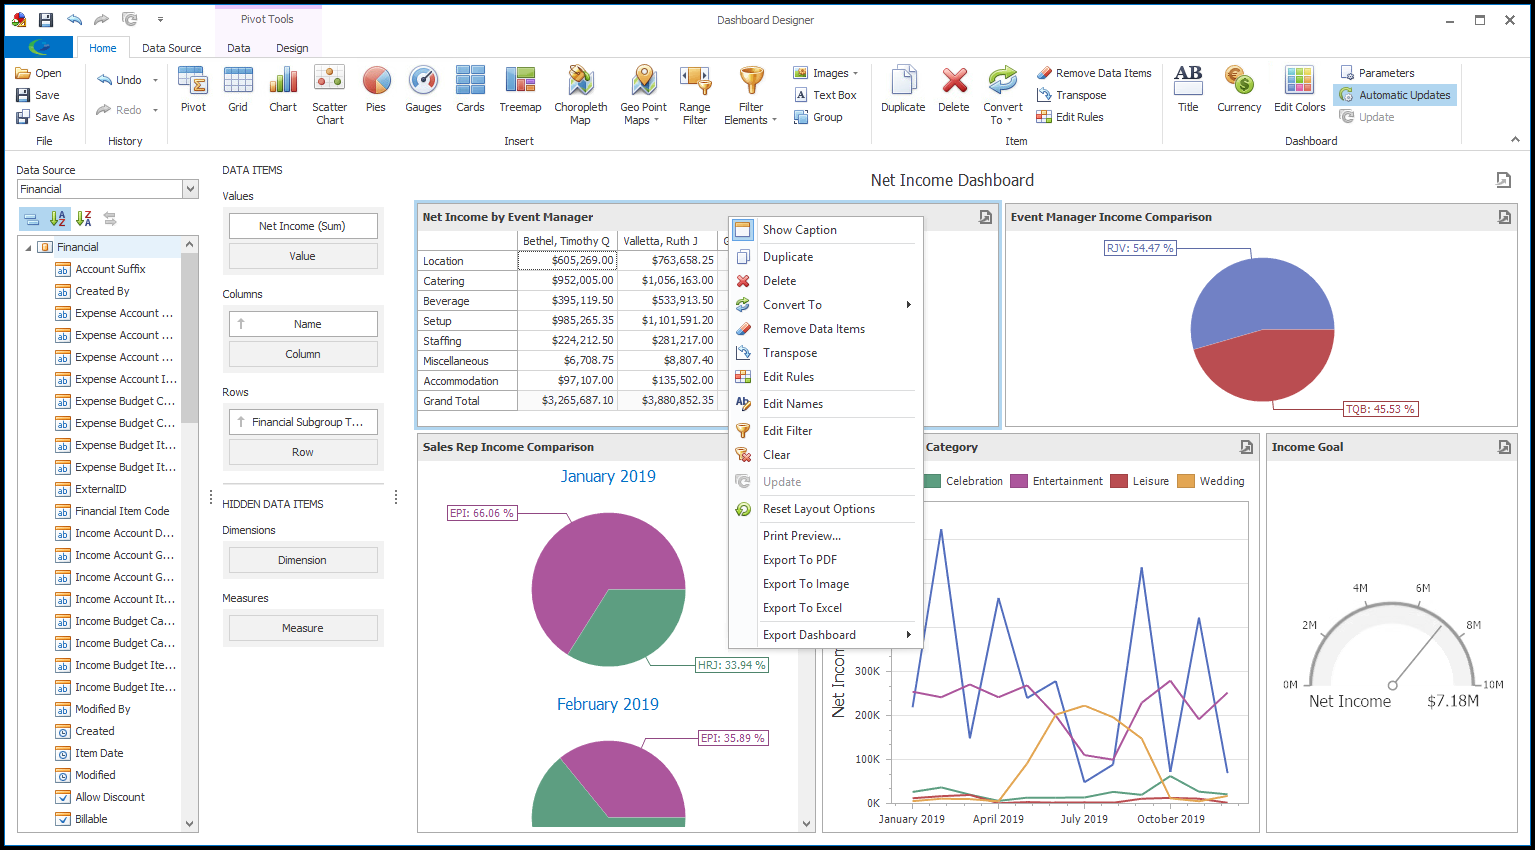
3.Note that many of the Design Tools are also available in the speed menu after right-clicking the relevant Dashboard Item.
4.While the Design Tools will vary according to Dashboard Item Type, all types will have at least the Show Caption and Edit Names buttons.
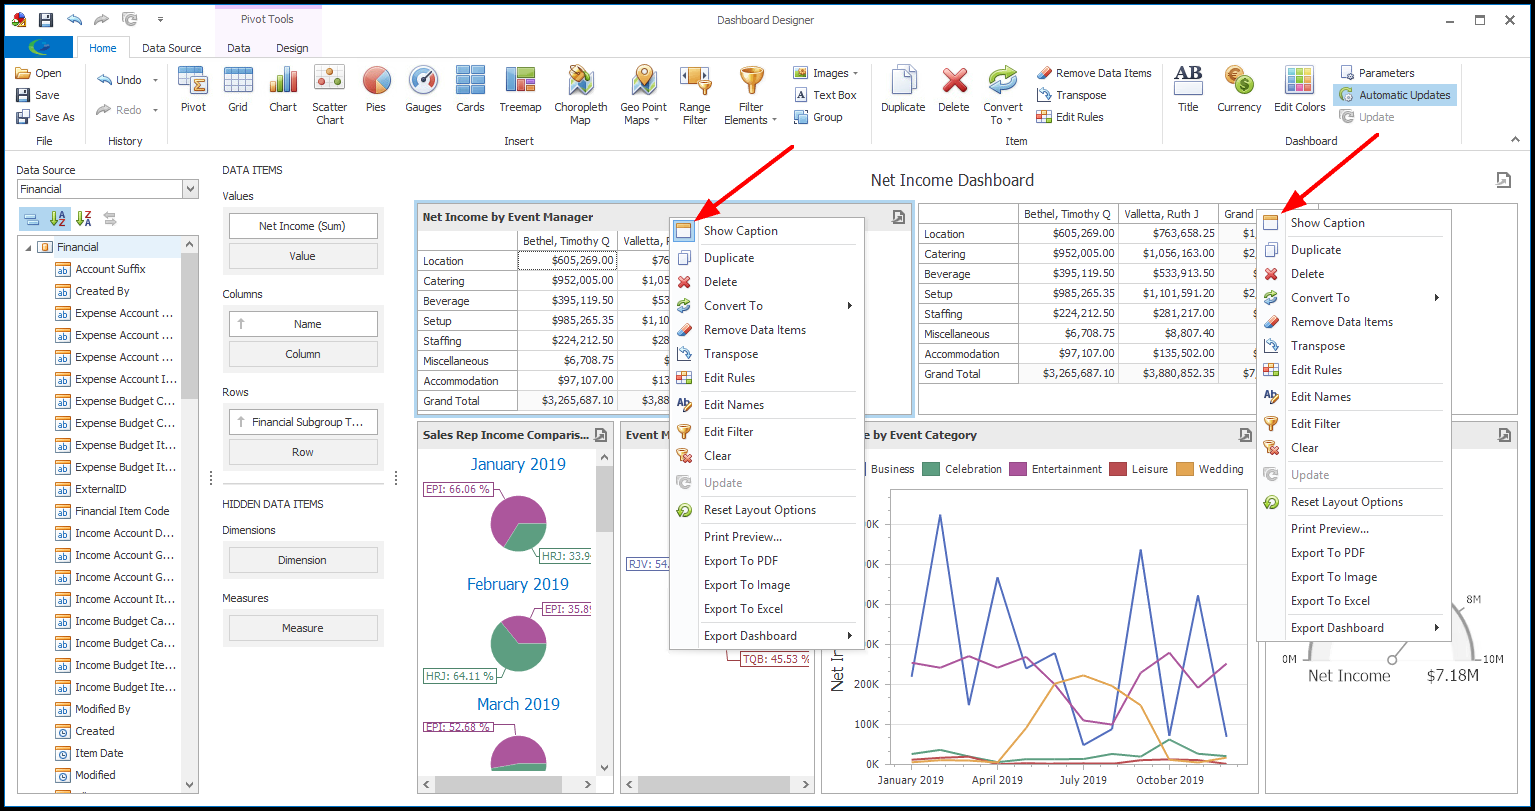
a.Show Caption: Clicking the Show Caption button in the Design ribbon or selecting Show Caption in the right-click speed menu will toggle between hiding and showing the Dashboard Item's caption.
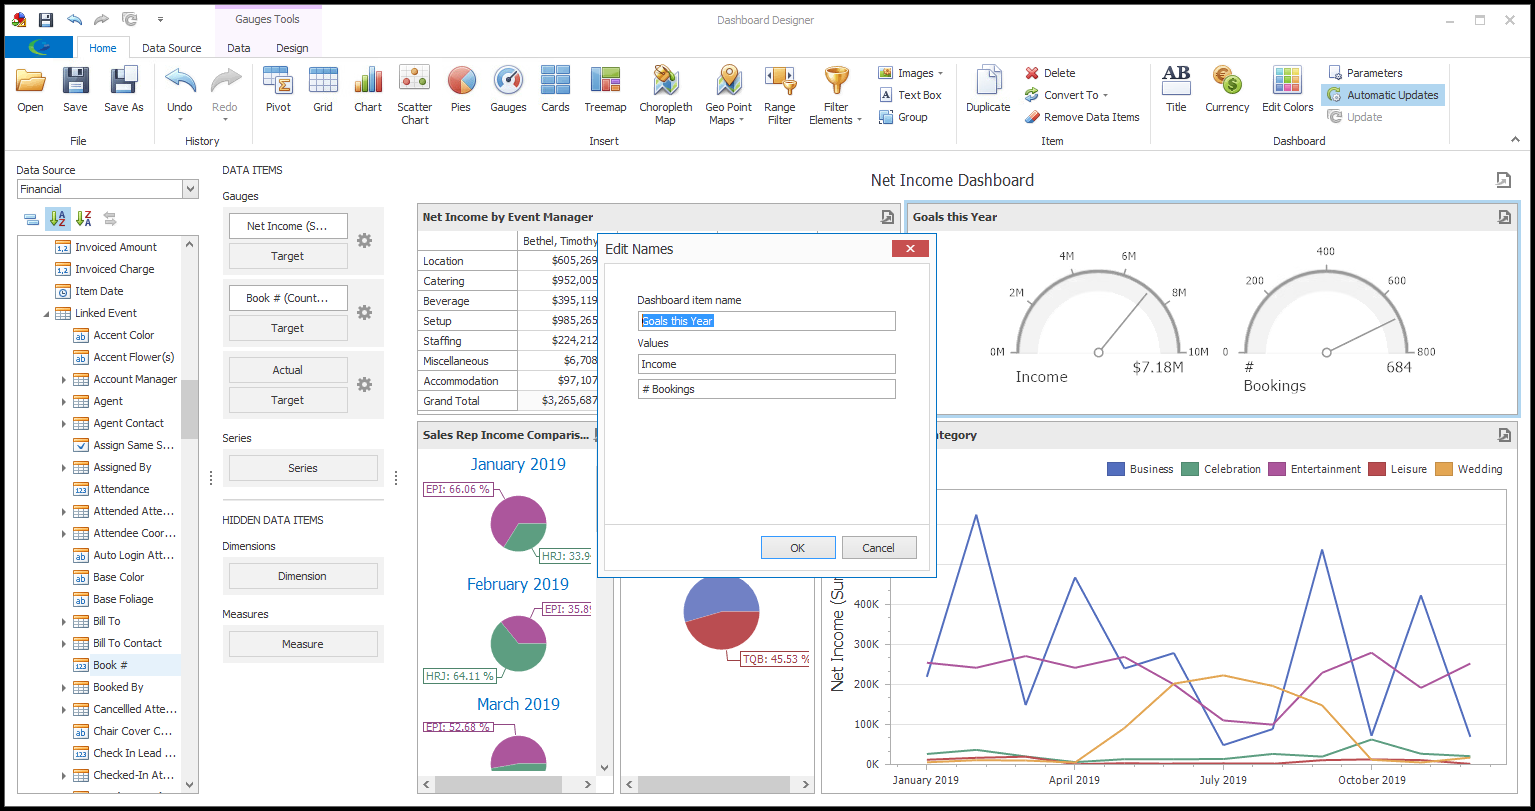
i.To change the captions in the Dashboard Item, click Edit Names in the Design ribbon, or select Edit Names from the right-click speed menu.
ii.In the Edit Names dialog, you can type in a new name for the Dashboard Item, and depending on the type, the captions for Values, as well.
iii.Click OK.
5.Another Design Tool common to many Dashboard Item Types (Chart, Scatter Chart, Pie, Pie Map, Range Filter, and Treemap) is the Coloring Editor.
For more information, see Edit Color Schemes.
6.To view examples of Pivot Grid Design Tools, see the Pivot Grid Example under Dashboard Examples.
7.To view examples of Pie Design Tools, see the Pie Example under Dashboard Examples.
8.To view examples of Gauge Design Tools, see the Gauge Example under Dashboard Examples.
9.To view examples of Chart Design Tools, see the Chart Example under Dashboard Examples.