1.In the Dashboard Designer, click the Pivot button to add a new Pivot Grid to the designing area.
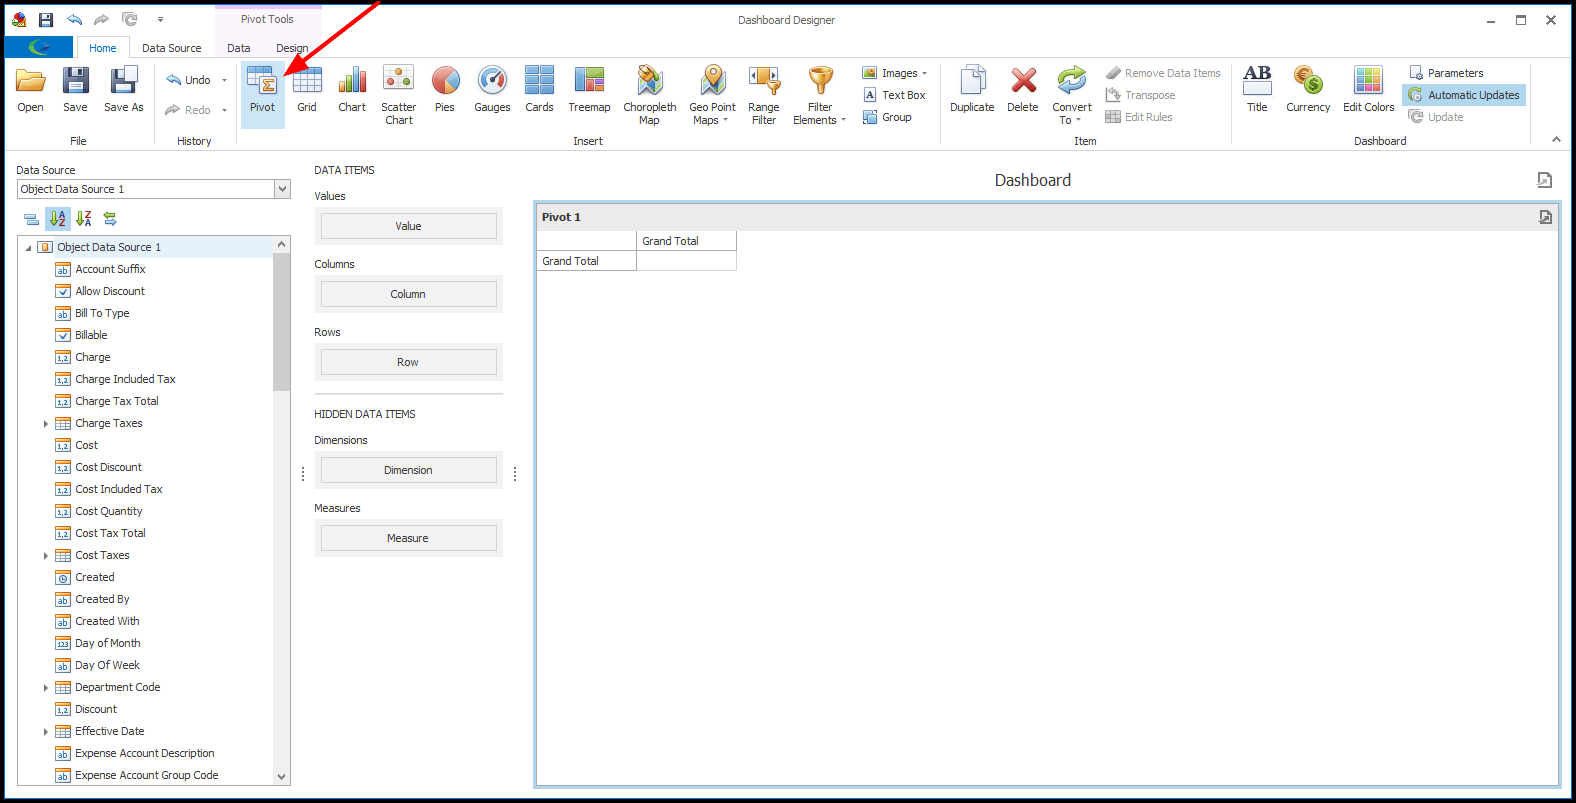
2.Next, you will bind the Pivot Grid to Data by dragging and dropping data fields onto the DATA ITEMS. Review Bind Item to Data.
Remember, you can Group/Ungroup  and Sort
  the available data fields using the toggle buttons above the list.
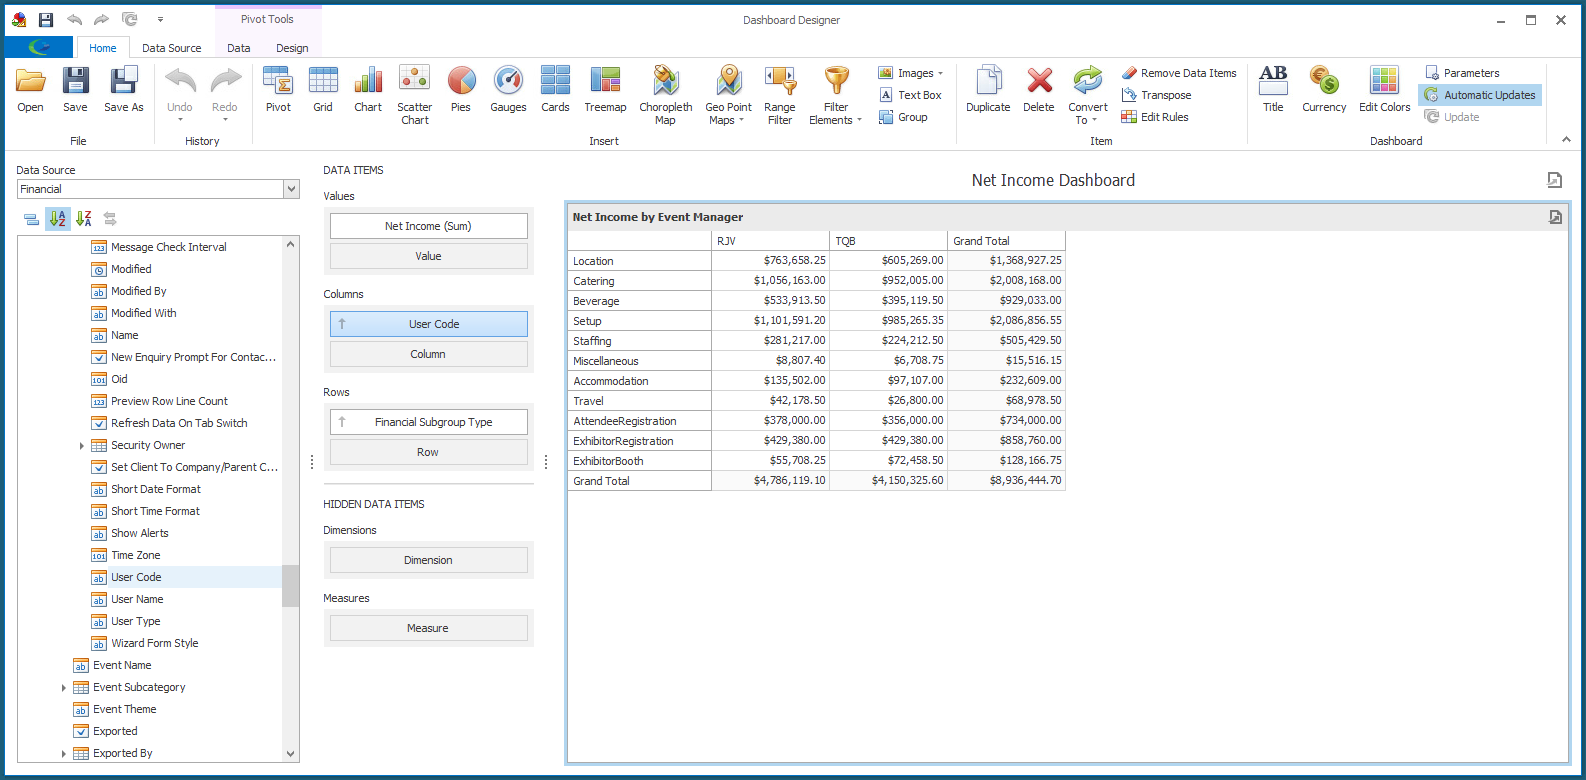
In our example, we want to see how much income each Event Manager brings in per Financial Subgroup Type, so we are going to drag and drop the following fields onto the described Data Items:
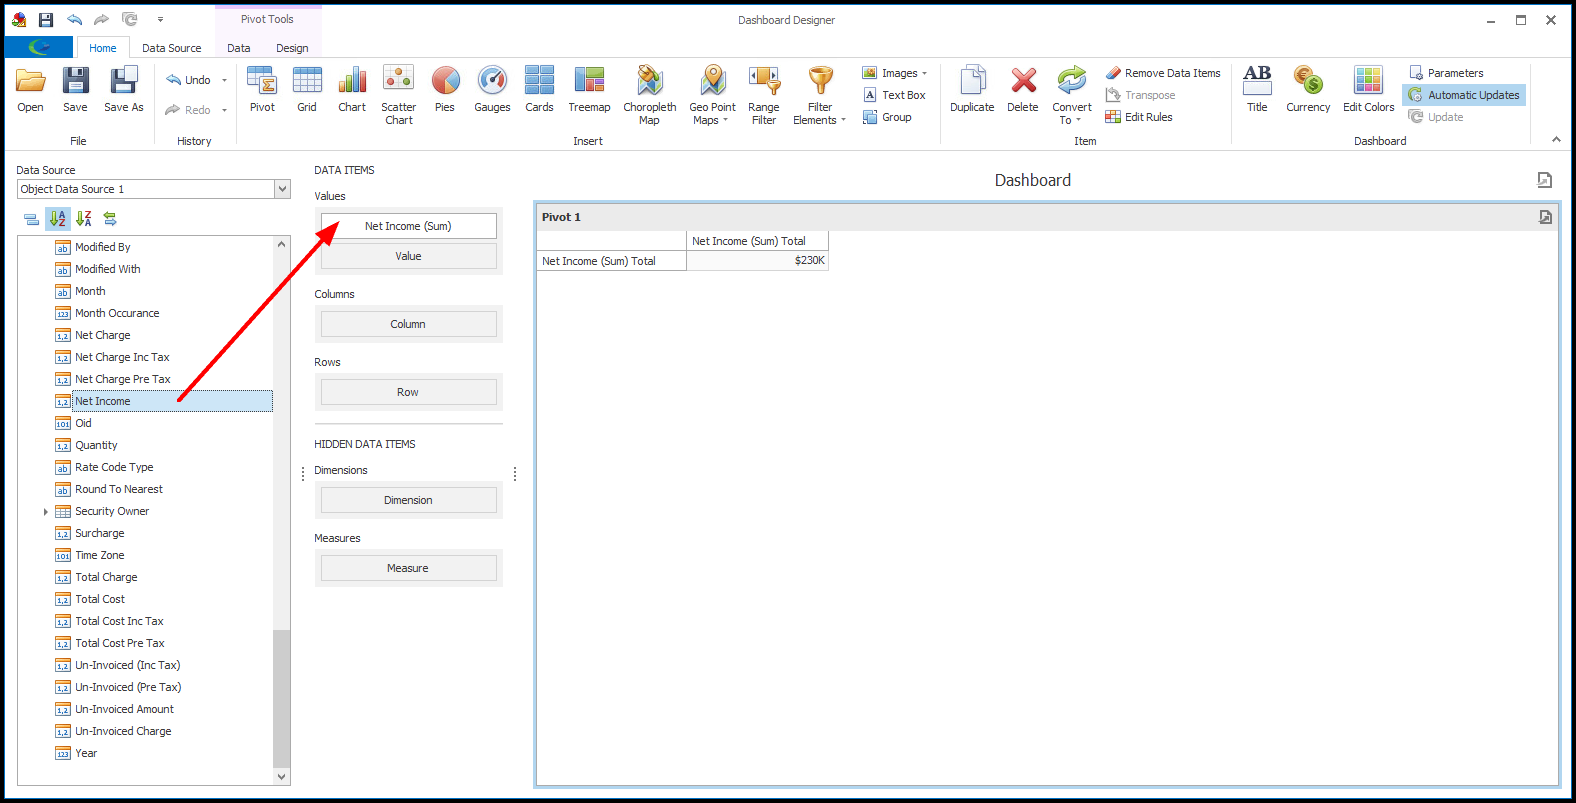
a.Net Income field for Values
b.Event Manager (User Code) field for Columns
c.Financial Subgroup Type field for Rows
a.It may take a bit of scrolling to find the fields you want to use. Here are some tips for finding the fields in this particular example:
i.The Net Income field isn't grouped with any other fields, so you can find it by scrolling down through the list.
ii.The Financial Subgroup Type field is also listed independently.
iii.To find the Event Manager field, go under Linked Event > Event Manager > User Code.
b.If you need to adjust the column widths to fit the results, drag-and-drop the splitter bars between cells.
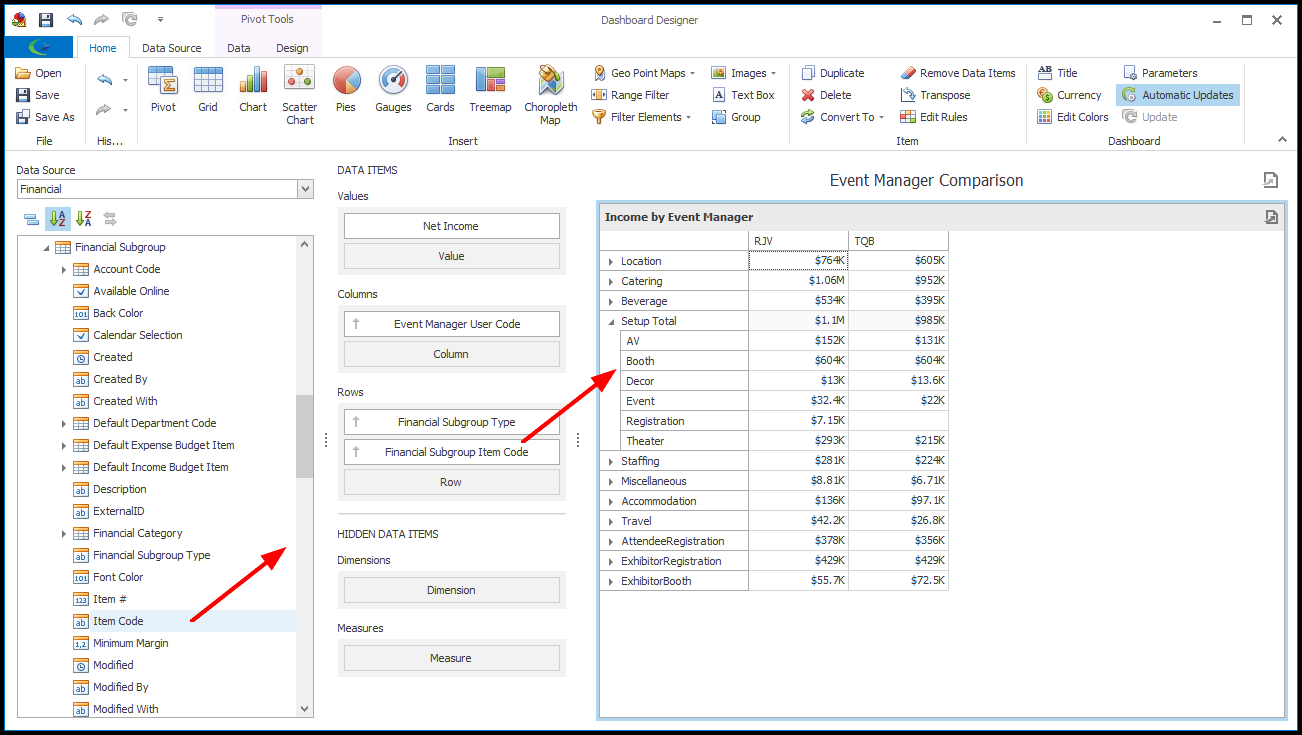
3.We are now going to add a second field under Rows.
a.Find the Financial Subgroup > Item Code field, and drag-and-drop it onto the Row Data Item under Financial Subgroup Type.
b.We have renamed the data item to "Financial Subgroup Item Code".
c.The Financial Subgroups will now appear grouped under the applicable Financial Subgroup Types. Click the arrow next to a Financial Subgroup Type to expand the rows below.
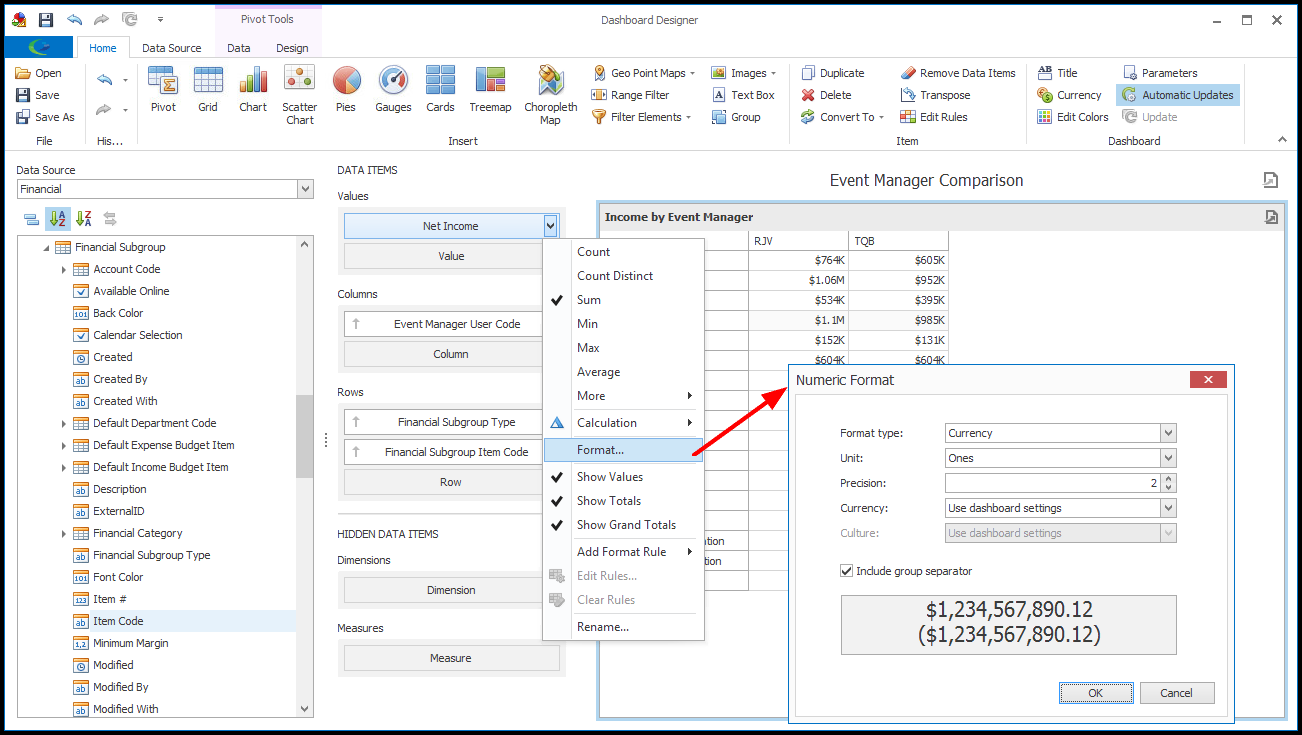
4.Next, we want to change how the Net Income values appear.
a.By default, the Dashboard uses an abbreviated currency format, e.g. $224K, but we want currency values formatted like this: $224,000.00.
b.You can review how to change the Currency Format in Shape, Format & Filter Data.
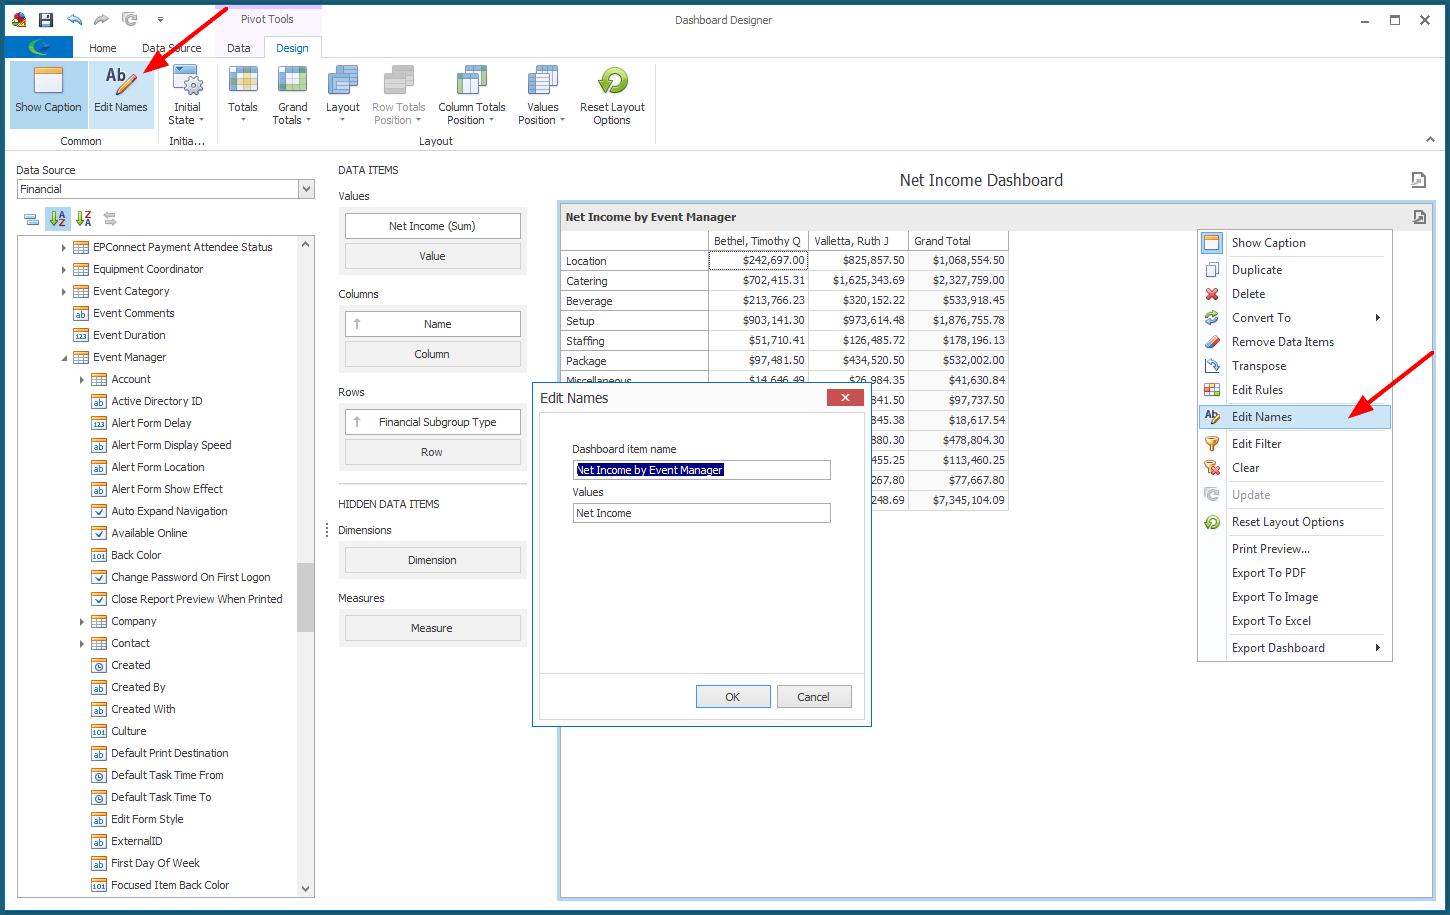
5.Next, we are going to change the Dashboard Title and Pivot Grid Caption to names that are more explanatory.
Review the instructions above to edit the Dashboard Title (Edit Dashboard Properties) and Dashboard Item Caption (Design Dashboard Item).
6.We now have a basic Pivot Grid completed, but we are going to add some additional visual elements to it with conditional formatting rules.
To review how to set up Format Rules for a Dashboard Item, see Conditional Formatting.
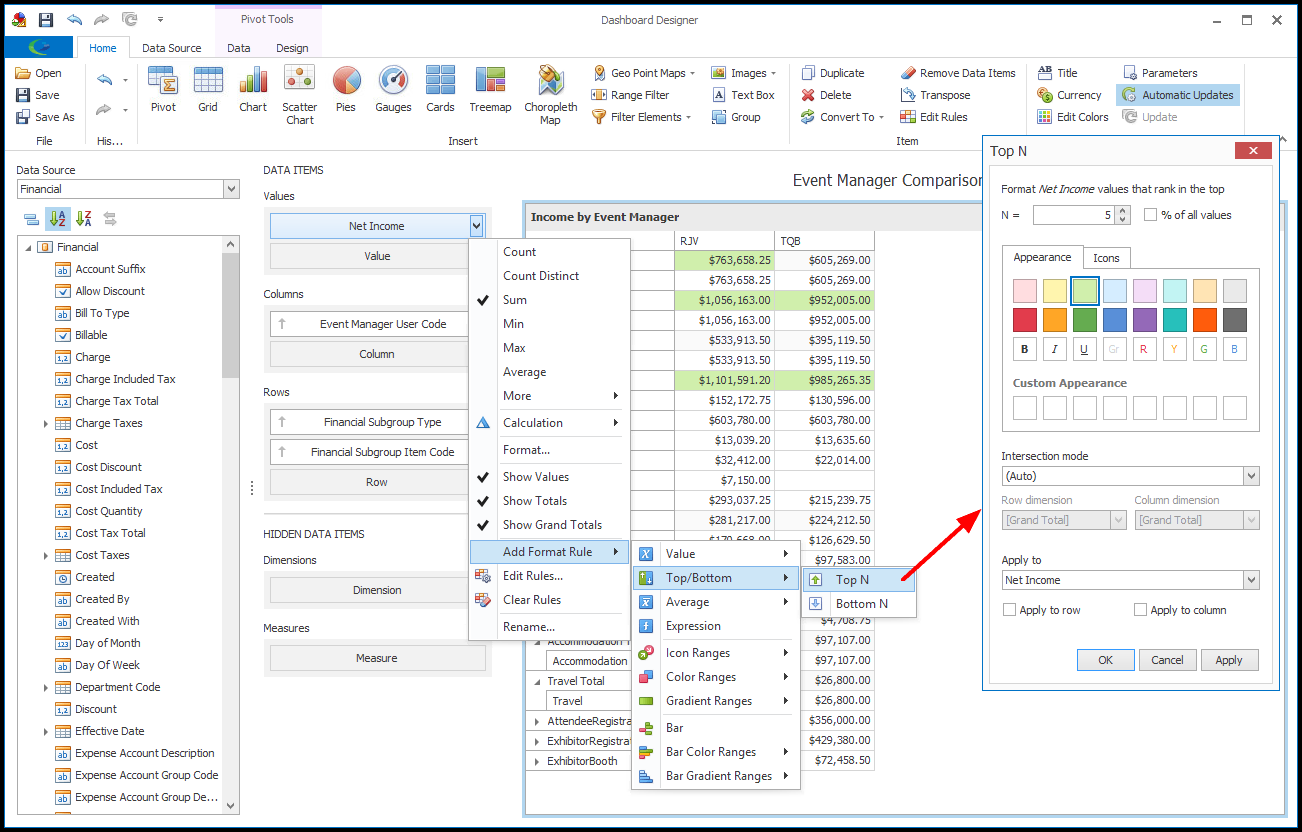
a.In our example, we are going to highlight the Top 5 values green, and the Bottom 5 values red.
b.Use the drop-down menu next to the Net Income Data Item to select Add Format Rule > Top/Bottom > Top N.
Adjust the settings for the Top N condition. In our example, we set N = 5, and selected light green under Appearance.
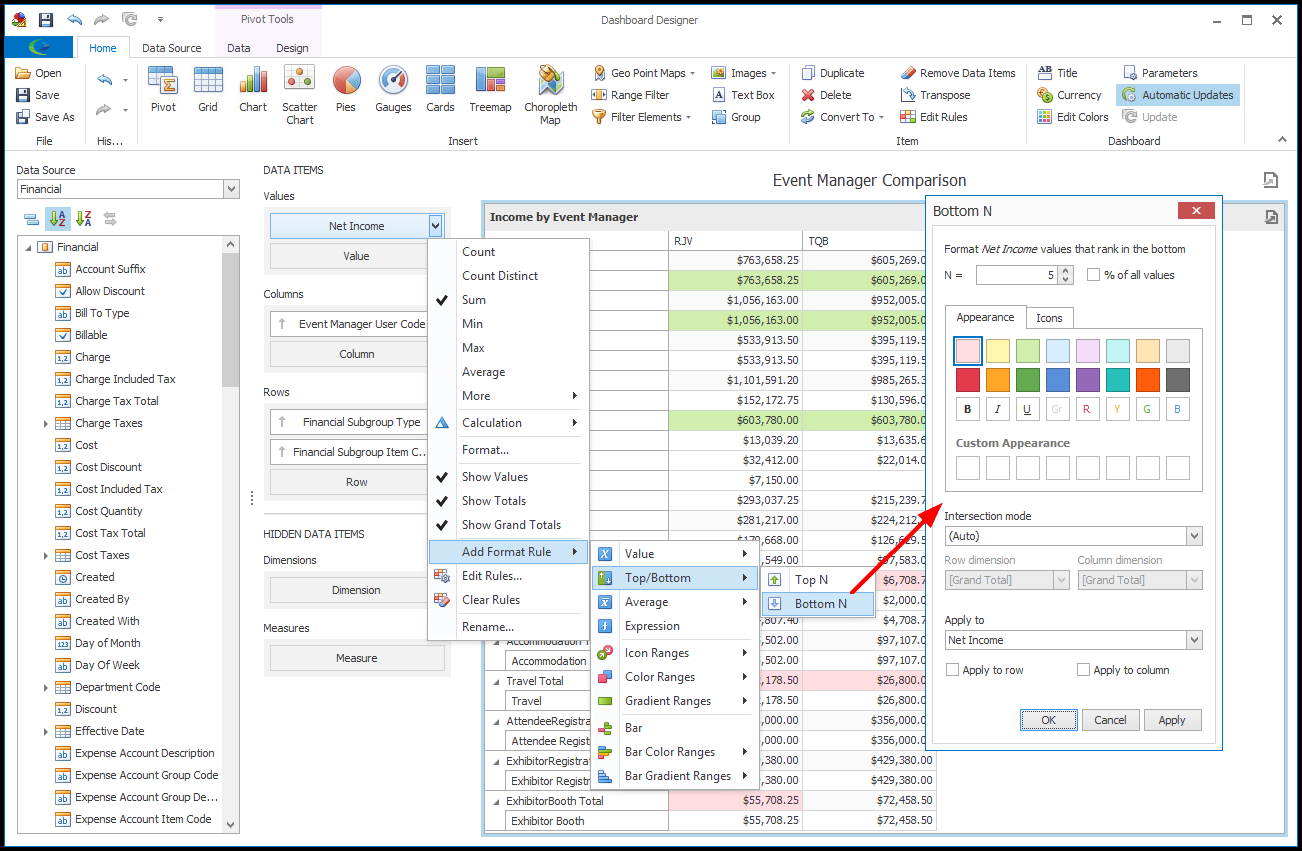
c.Then, return to the Net Income menu, and select Add Format Rule > Top/Bottom > Bottom N.
Adjust the settings for the Bottom N condition. In our example, we set N = 5, and selected light red under Appearance.
d.Remember that you can review all of the Pivot Grid's formatting rules by clicking the Edit Rules button in the top ribbon.
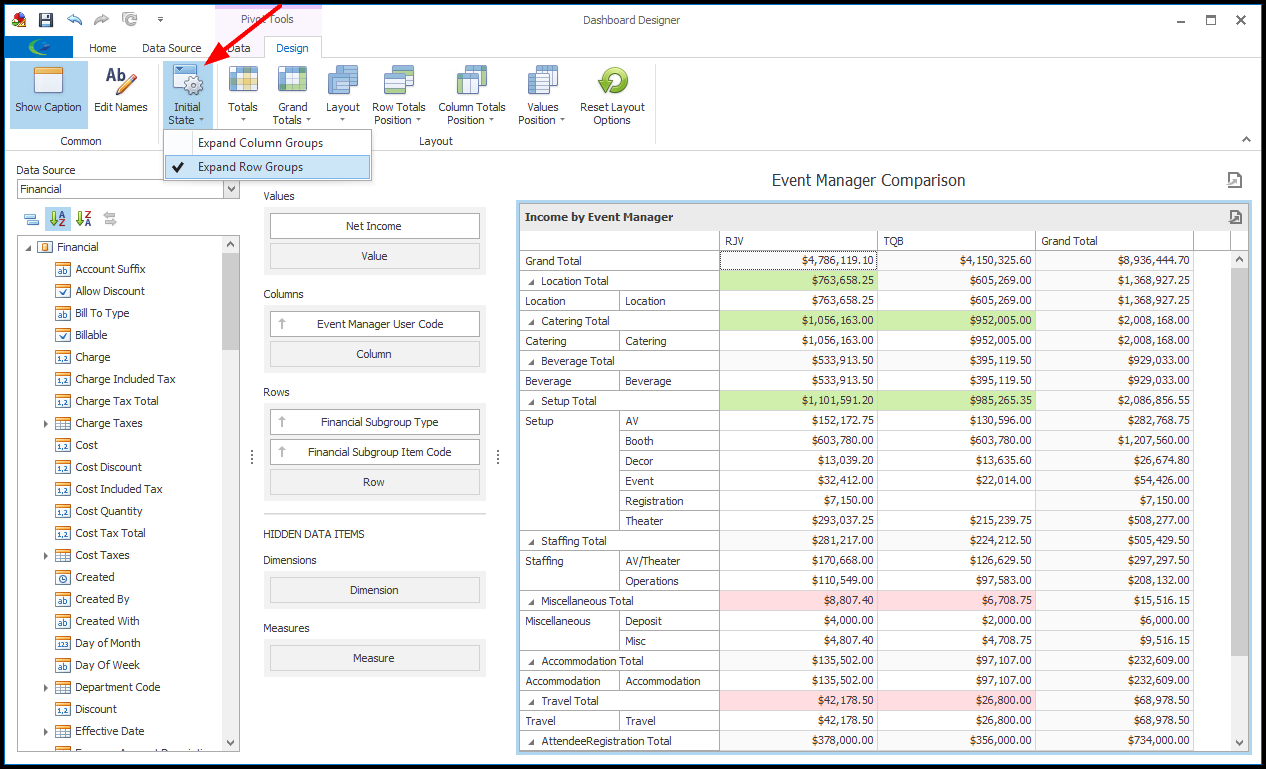
7.We will now go to the Design tab of the top ribbon, where we can access Design Tools for the Pivot Grid.
As you will recall from Design Dashboard Item, the Design Tools will vary depending on the type of Dashboard Item, although Show Caption and Edit Names will be common to most types.
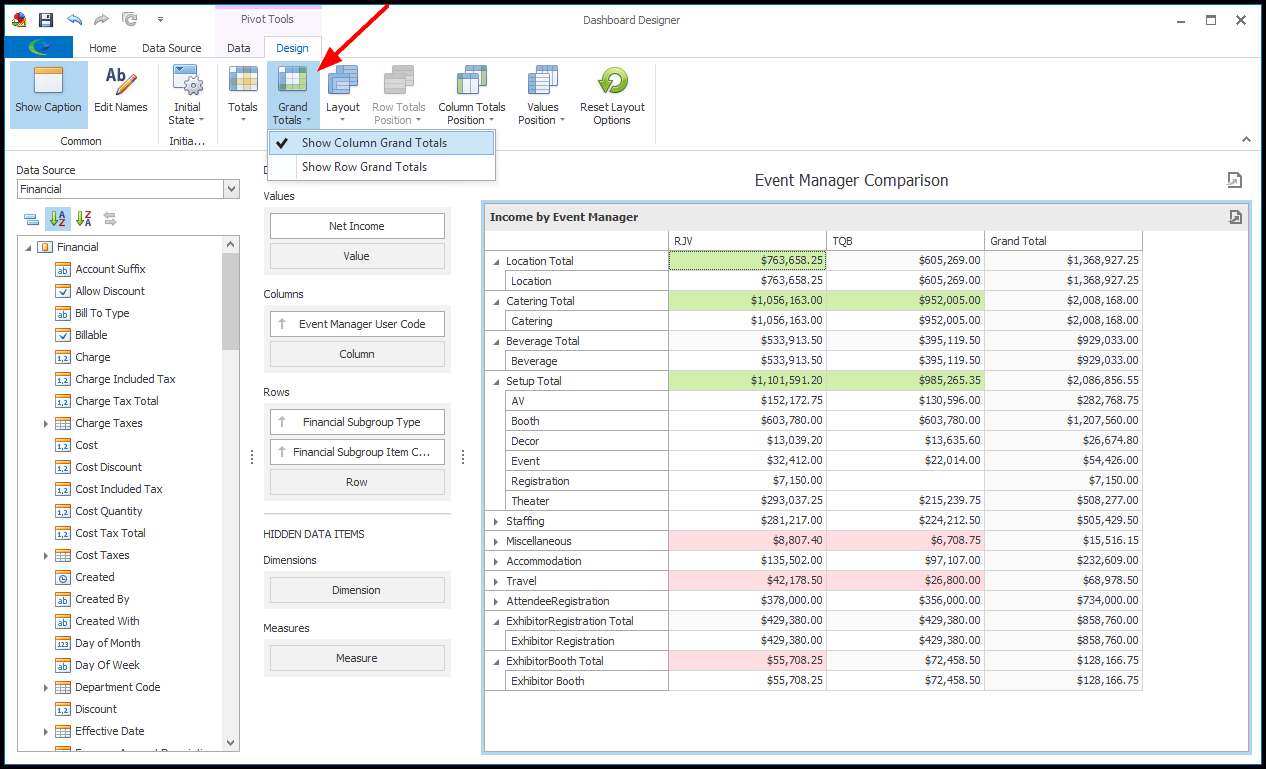
a.Use the options under the Grand Totals button to indicate whether you want to Show Column Grand Totals and Show Row Grand Totals.
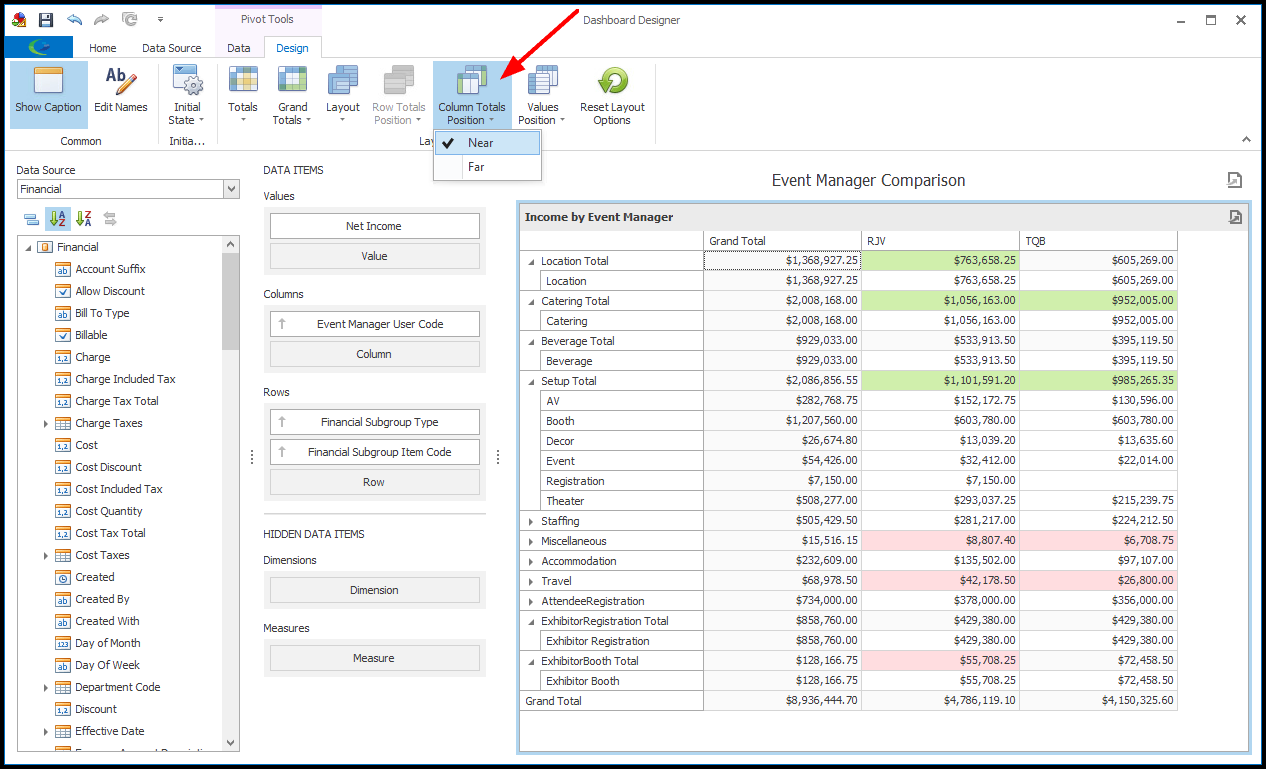
b.If you decide to show the column totals, you can select an option under Column Totals Position to indicate whether you want the Grand Totals column Near (closest to the y-axis) or Far (farthest from the y-axis).
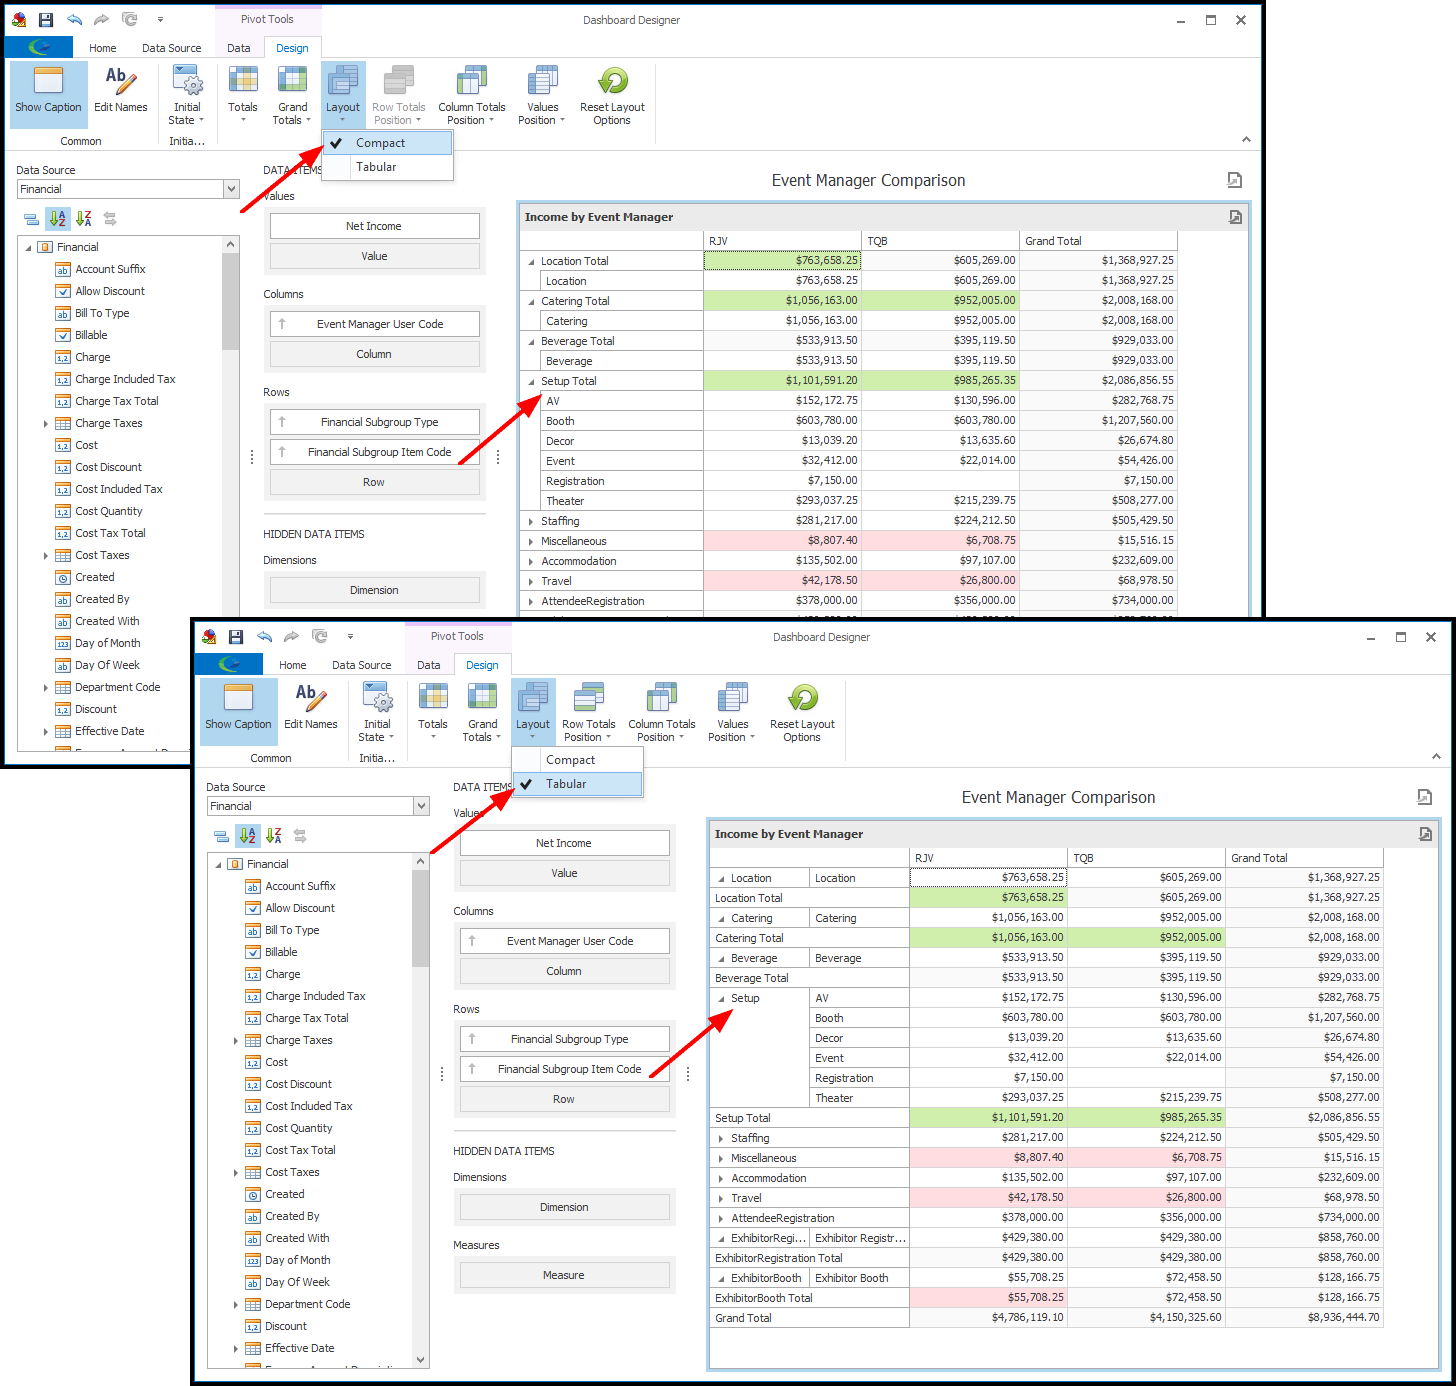
c.Under the Layout button, you can choose the Compact layout or the Tabular layout.
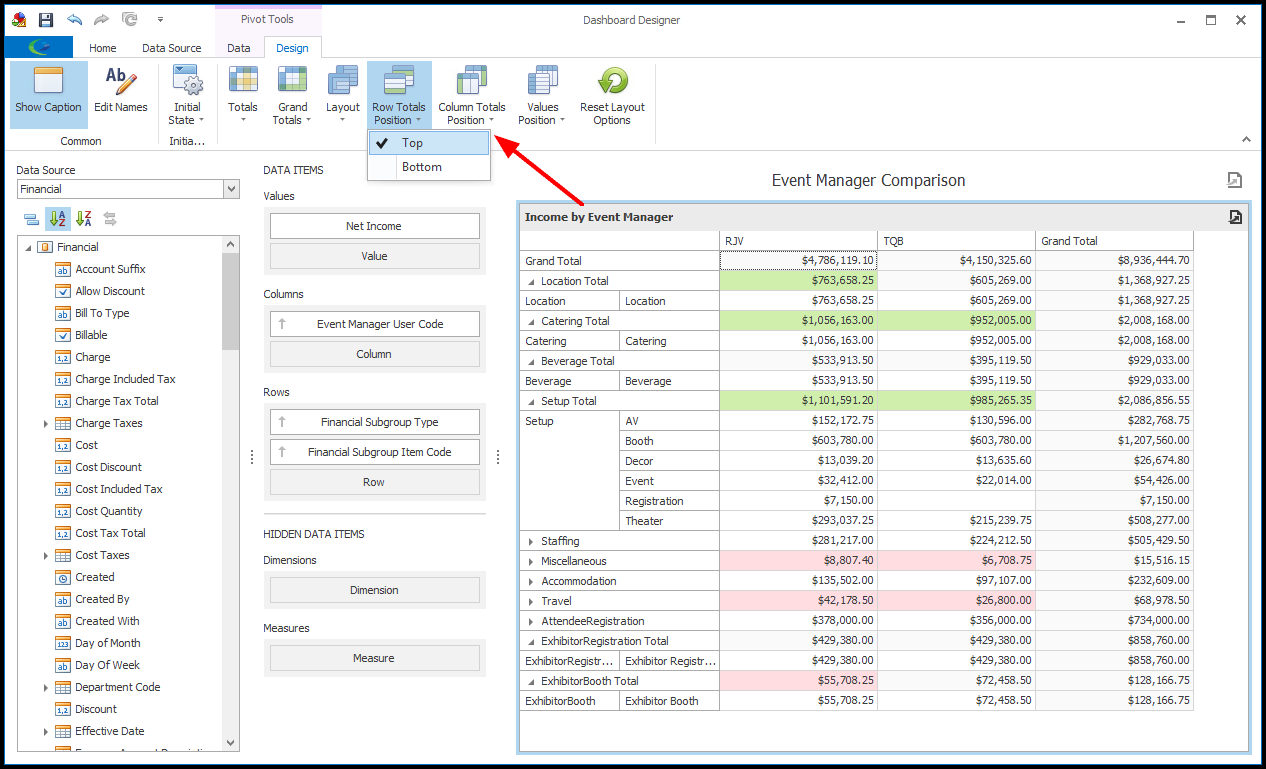
d.If you select the Tabular layout, you can select a Row Totals Position option: Top or Bottom.
e.Under the Initial State button, choose how you want this Pivot Grid to appear in the Dashboard Viewer by default.
Select the options if you want to Expand Column Groups and/or Expand Row Groups, or leave them unselected if you do not want them expanded by default.
8.If you want to make any other adjustments to the Pivot Grid item, review the instructions under Design Dashboard.
9.Ensure that you Save your changes before exiting the Dashboard Designer.