1.Click the Pies button to add a new Pie Chart to the designing area.
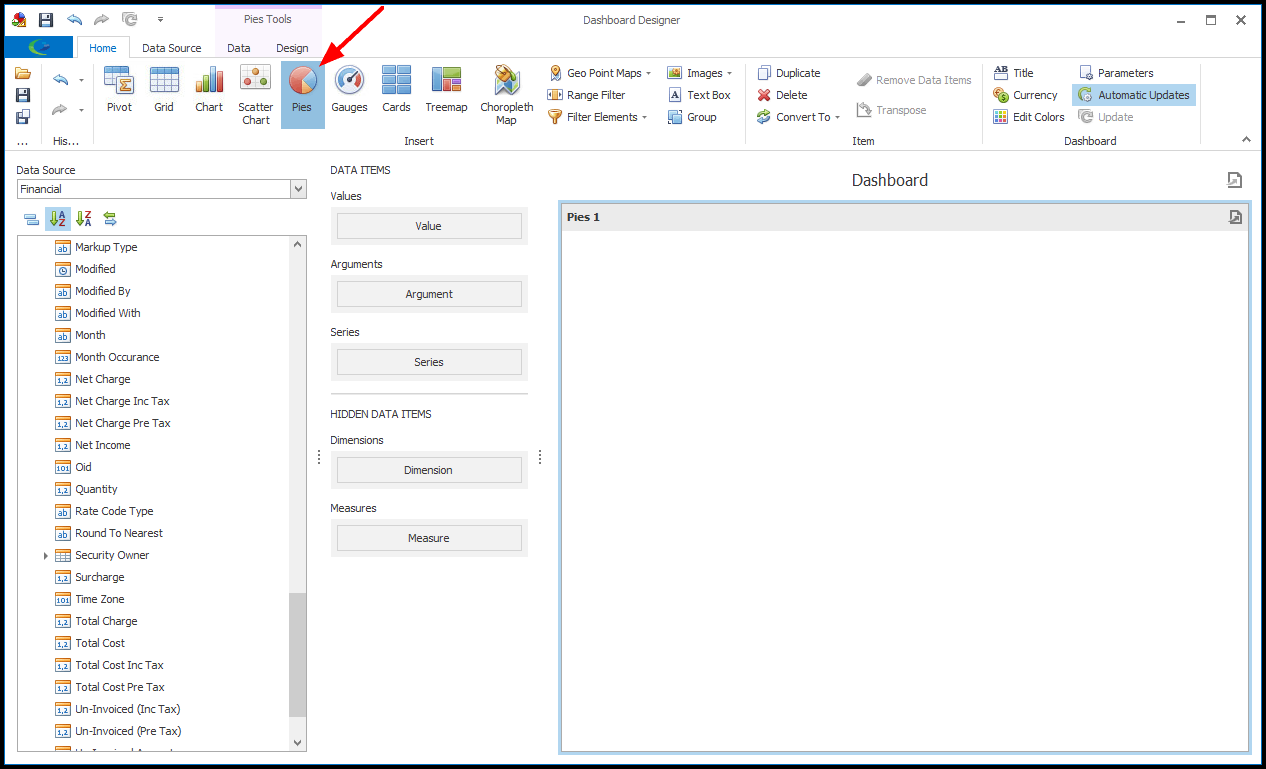
2.Drag-and-drop the fields you want to use onto the Data Items in the center column, i.e. Value, Arguments, and Series.
You can review Bind Item to Data and Shape, Format & Filter Data for more information about data items.
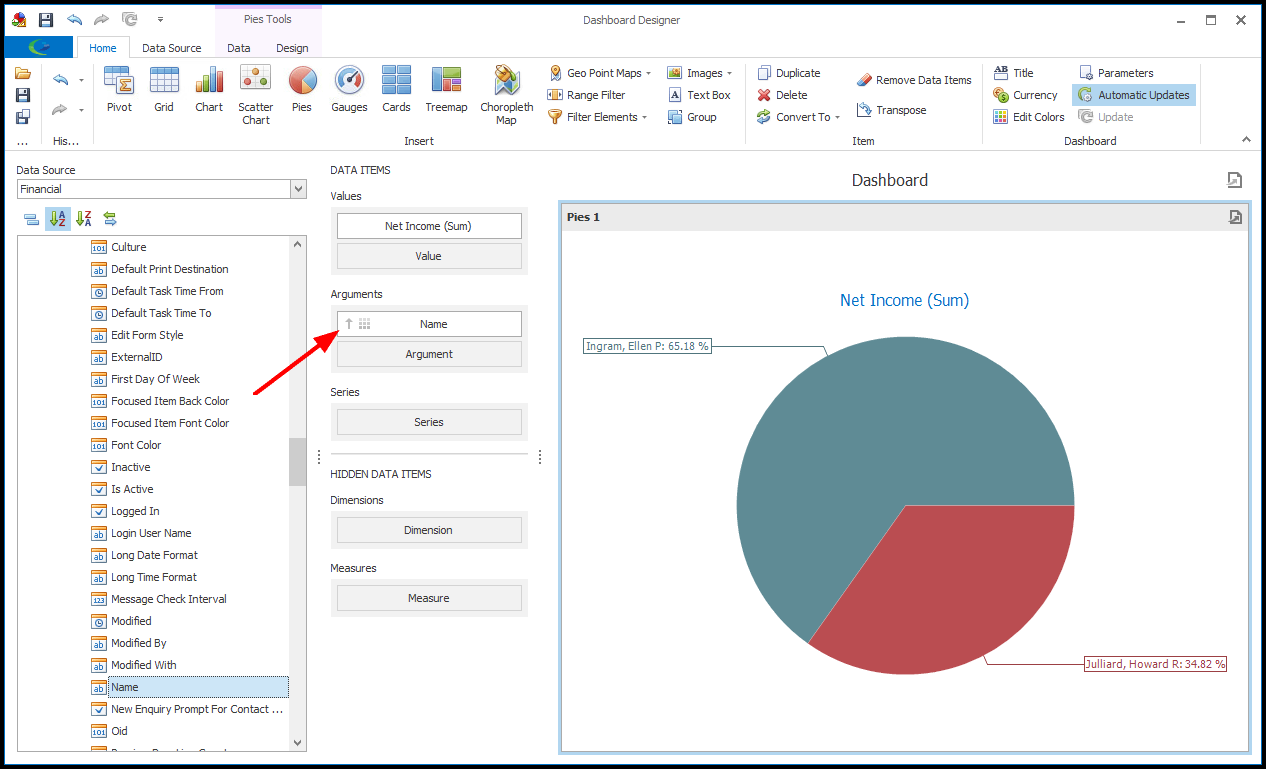
a.In our example, we will first add the Net Income (Sum) to Values, and the Account Manager Name to Arguments.
b.The linked Account Manager field can be accessed in a few different places in the Financial Data Field list, depending on the relationship you want to display in your chart. In our example, we want compare the Account Managers for the Net Income linked to Accounts (i.e. Companies and Contacts).
Therefore, we will find Linked To Account in the data fields, and use the Account Manager > Name field from there.
Remember that you can Rename the Data Item if that helps distinguish the different fields.
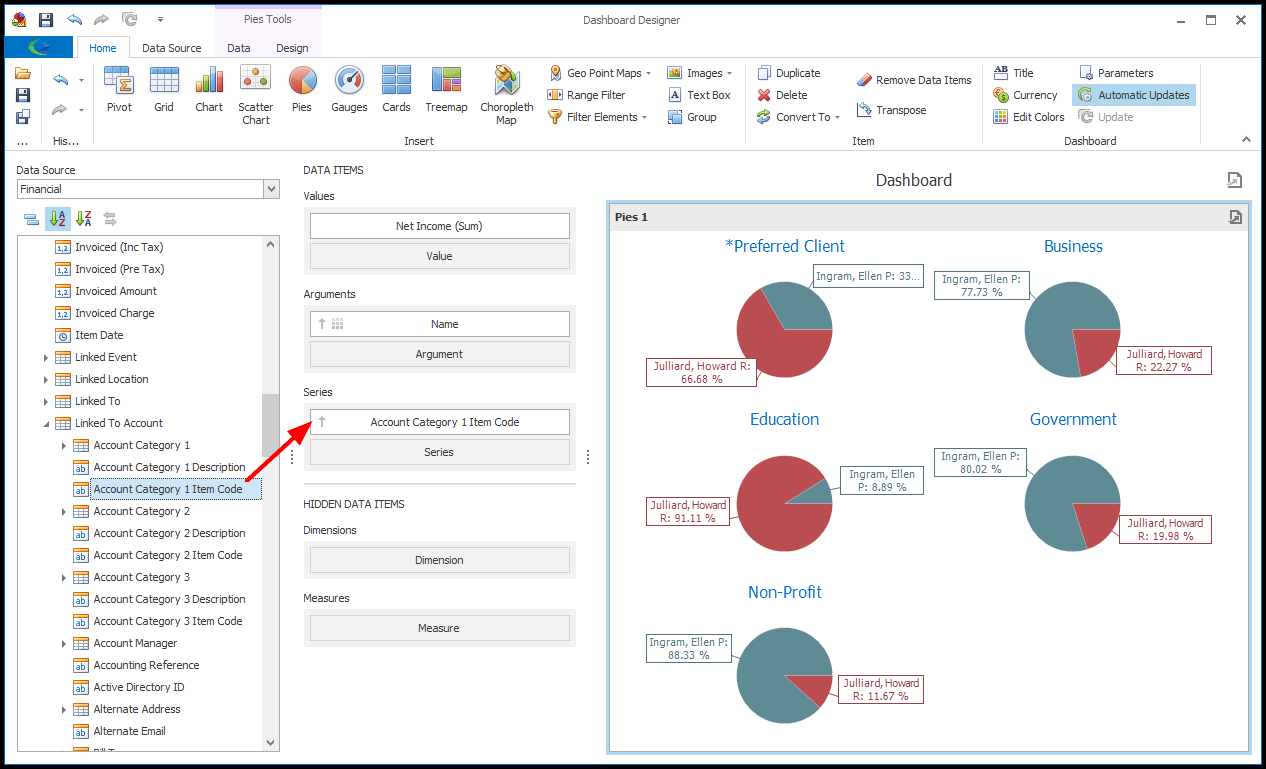
c.For our Series, we selected Linked To Account > Account Category 1 Item Code. This allows us to compare Account Manager sales under each client Category (from the Account Category 1 list). In other words, we see the Total Income for each Category broken down by the responsible Account Manager.
IMPORTANT: The Account Category 1 field is an example of one of the specialized fields created to facilitate faster data retrieval. As explained in Bind Item to Data, certain Dashboard fields (such as Budget Items, Contact Categories, Account Categories, and Product Categories) had to be replaced by specialized fields in EventPro 18.
Therefore, instead of drilling down through Linked To Account > Account Category 1 > Item Code, you must use the Linked To Account > Account Category 1 Item Code field.
3.For a different perspective, you can click Transpose to flip the Argument and Series of the Pie Chart.
Click Transpose again to return to the original Argument and Series.
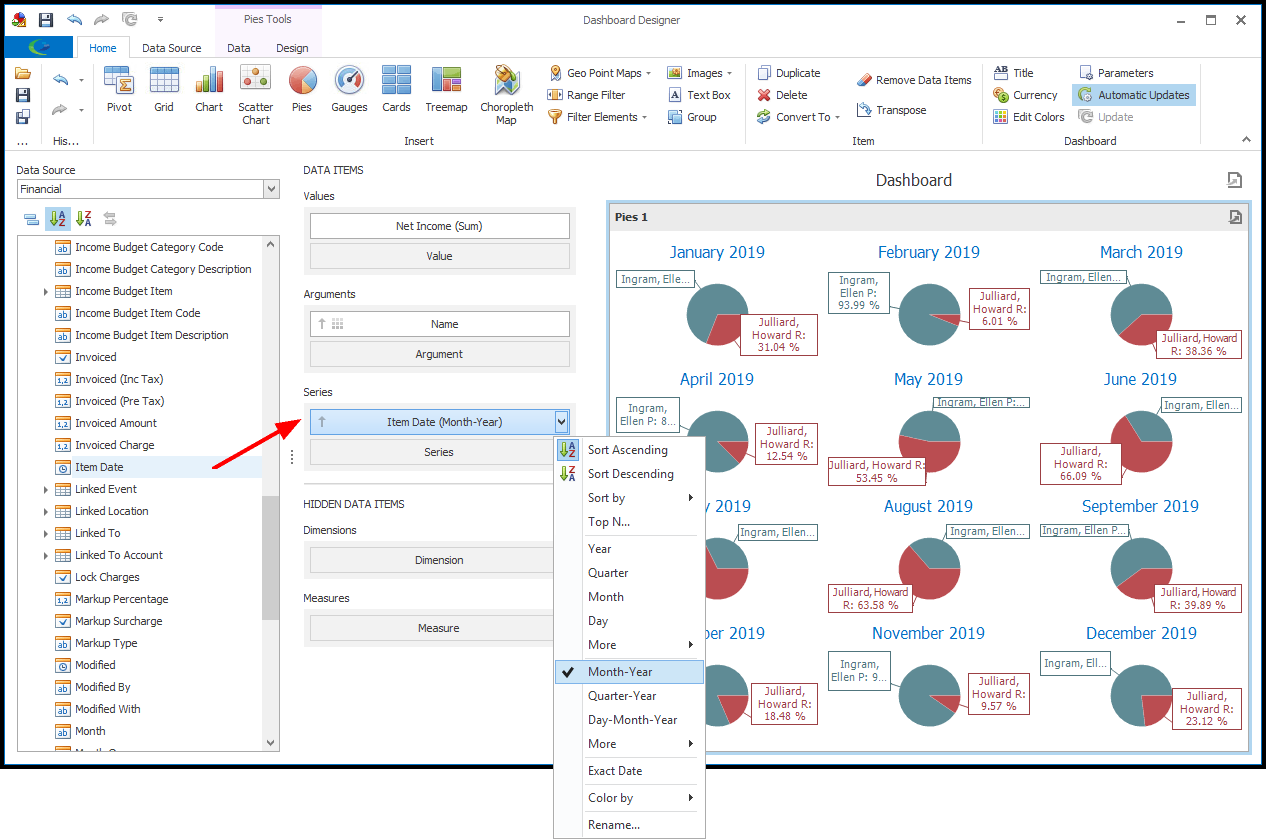
4.To view Net Income by Account Managers in other data relationships, you can try different Series.
a.In our example, we removed the Account Category 1 field by dragging-and-dropping it out of the Series Data Item.
b.We then dragged the Item Date field to the Series Data Item, and selected Month-Year to group the values. To review how to group data intervals, as well as other data shaping functions, see Shape, Format & Filter Data.
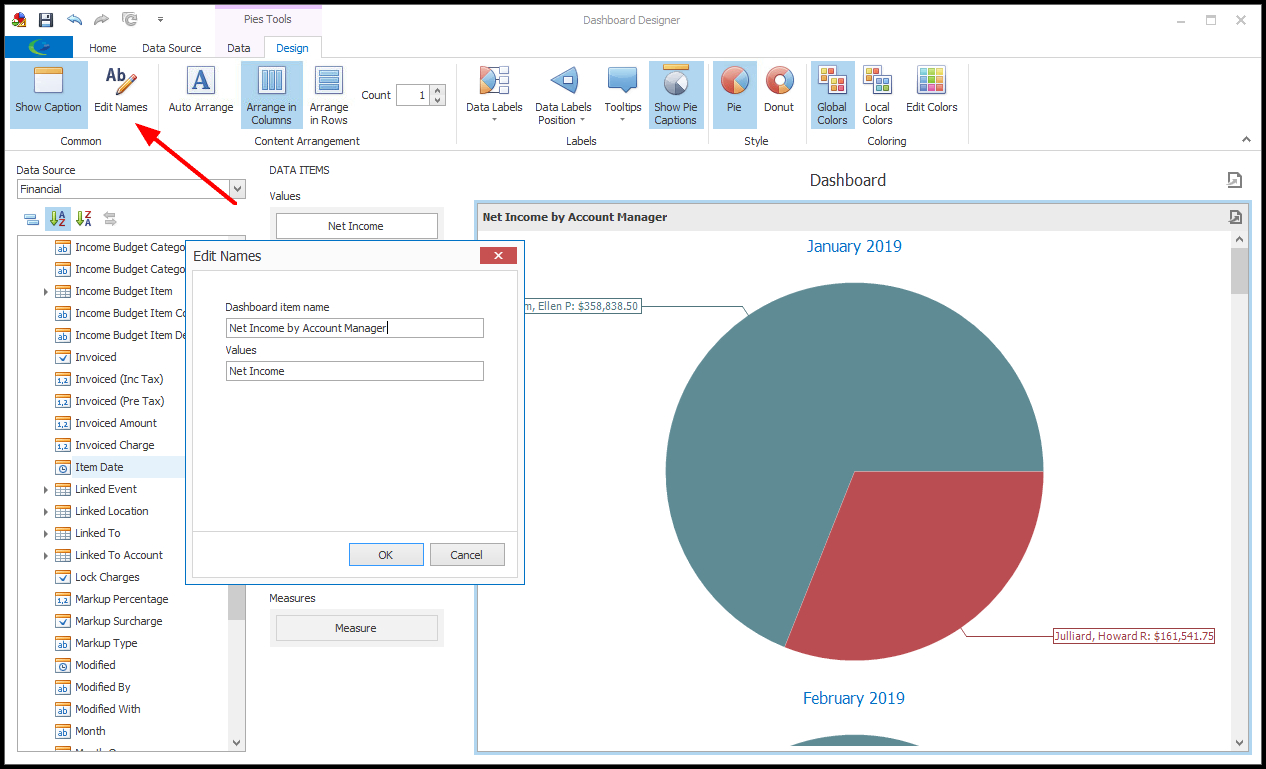
5.We will now go to the Design tab of the top ribbon, where we can access Design Tools for the Pie Chart.
As you will recall from Design Dashboard Item, the Design Tools will vary depending on the type of Dashboard Item, although Show Caption and Edit Names will be common to most types.
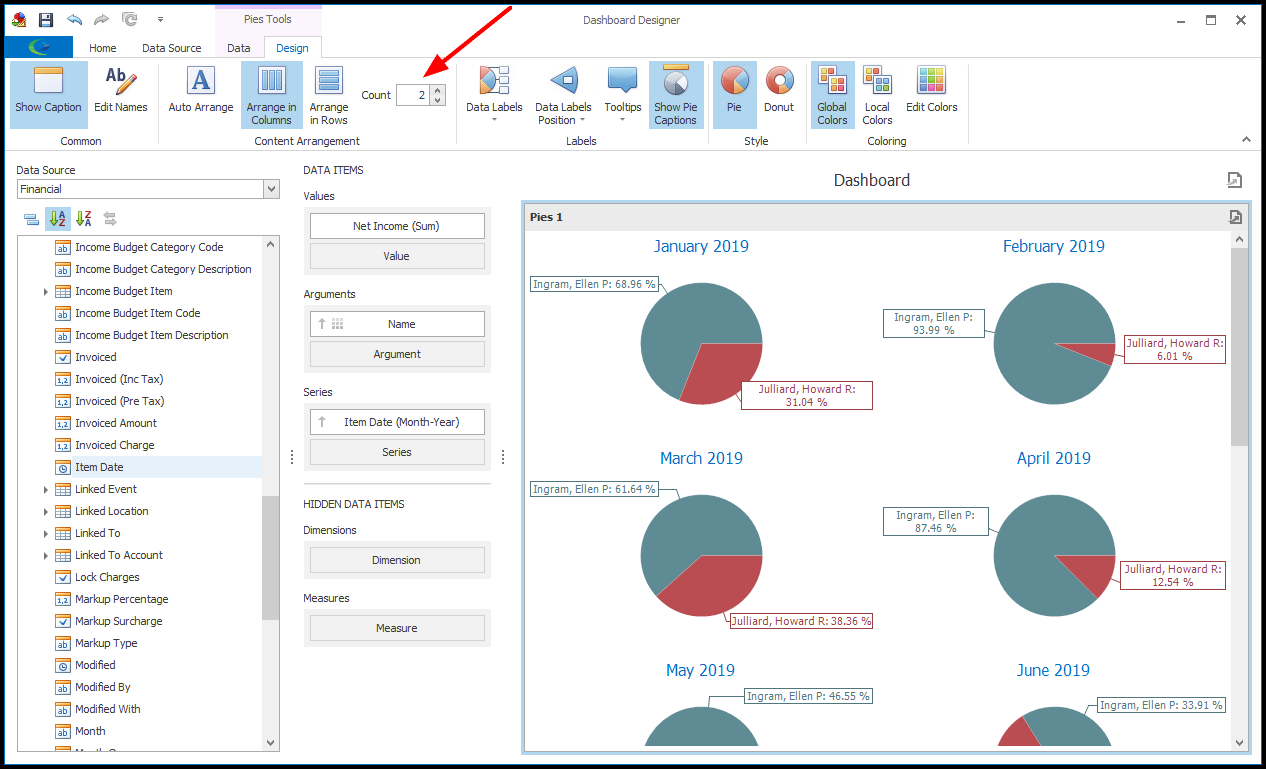
a.Content Arrangement: If there are multiple Pie Charts in your results, you can choose how you want them arranged.
In the Content Arrangement section, you can choose to Auto Arrange, Arrange in Columns, or Arrange in Rows.
If you select Arrange in Columns or Arrange in Rows, enter the number of columns/rows you want in the Count field.
b.Labels: By default, our example Pie will display each Account Manager's percentage of the total net income.
If you want to change the visible information in the Pie, you can select different options in the Labels section of the Design ribbon.
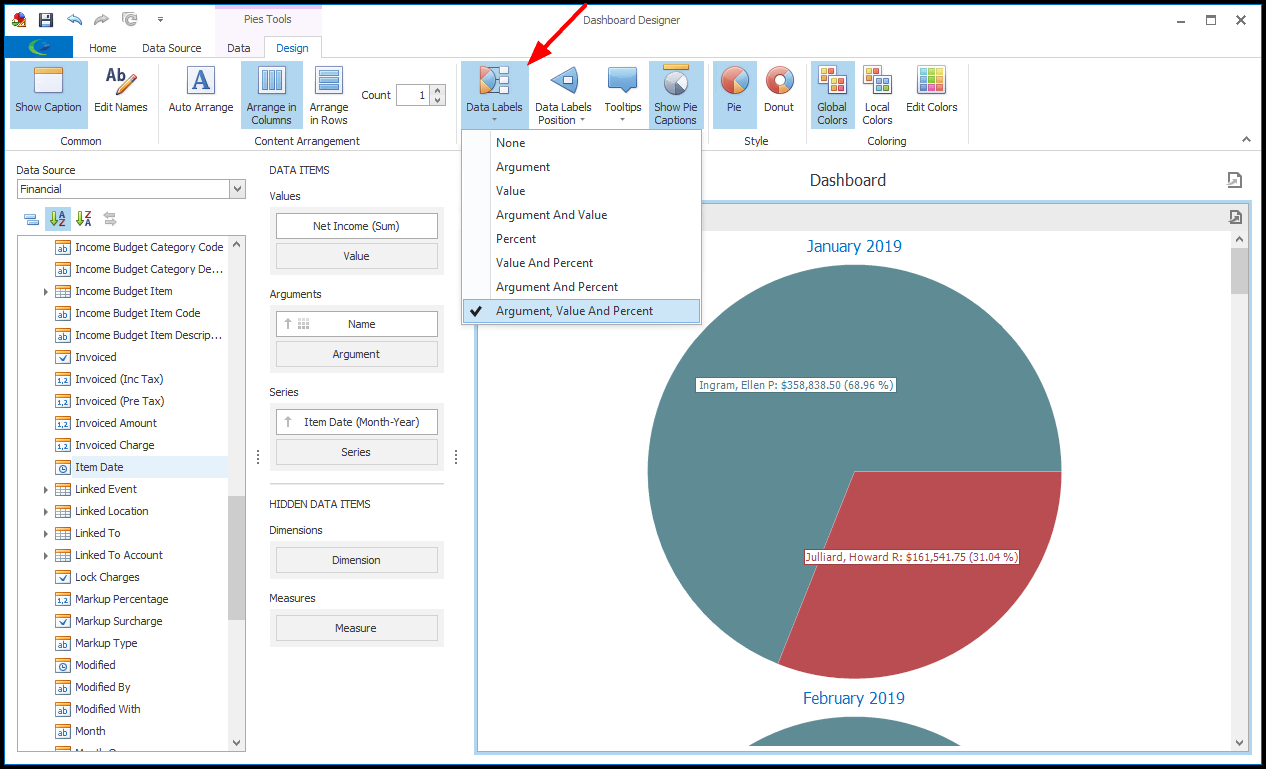
i.Choose a display option from the Data Labels drop-down.
ii.You can similarly choose what information is displayed in the Tooltips (the pop-up information bubbles that appear when you hover the mouse over a pie chart data area).
iii.From the Data Labels Position drop-down, you can choose whether the labels should be Inside or Outside the pie.
iv.Click the Show Pie Captions toggle to show/hide the captions for the individual Pies in the Pie Dashboard Item.
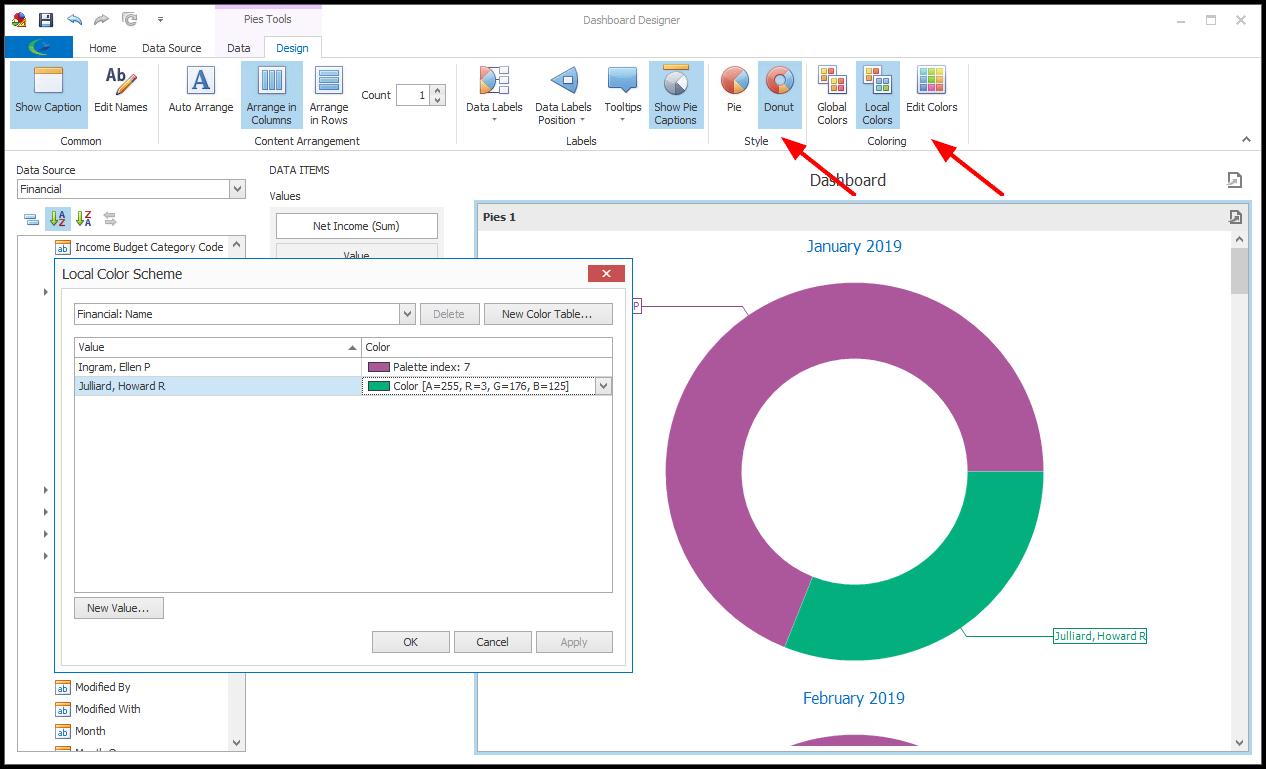
c.Style and Coloring: Select a Style for your Pie(s): Pie or Donut.
To review how to change Dashboard Item Coloring, see Edit Color Schemes.
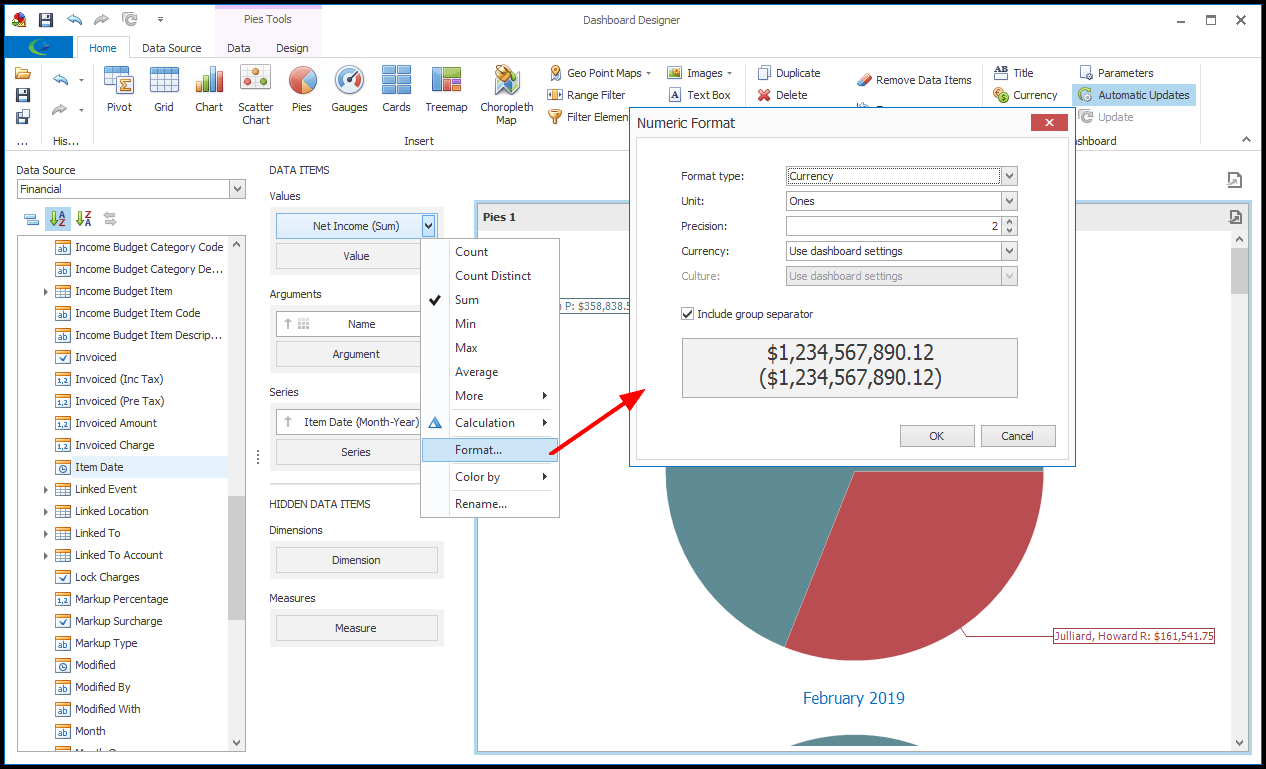
6.If you changed the Data Labels and/or Tooltips to display values, and you now want to change how the Currency is formatted, review Shape, Format & Filter Data.
7.To rename your Pie Chart Item, review the instructions under Design Dashboard Item.
8.We have completed our Pie Chart. If you want to make any other adjustments to the chart, review the instructions under Design Dashboard.
9.Ensure that you Save your changes before exiting the Dashboard Designer.