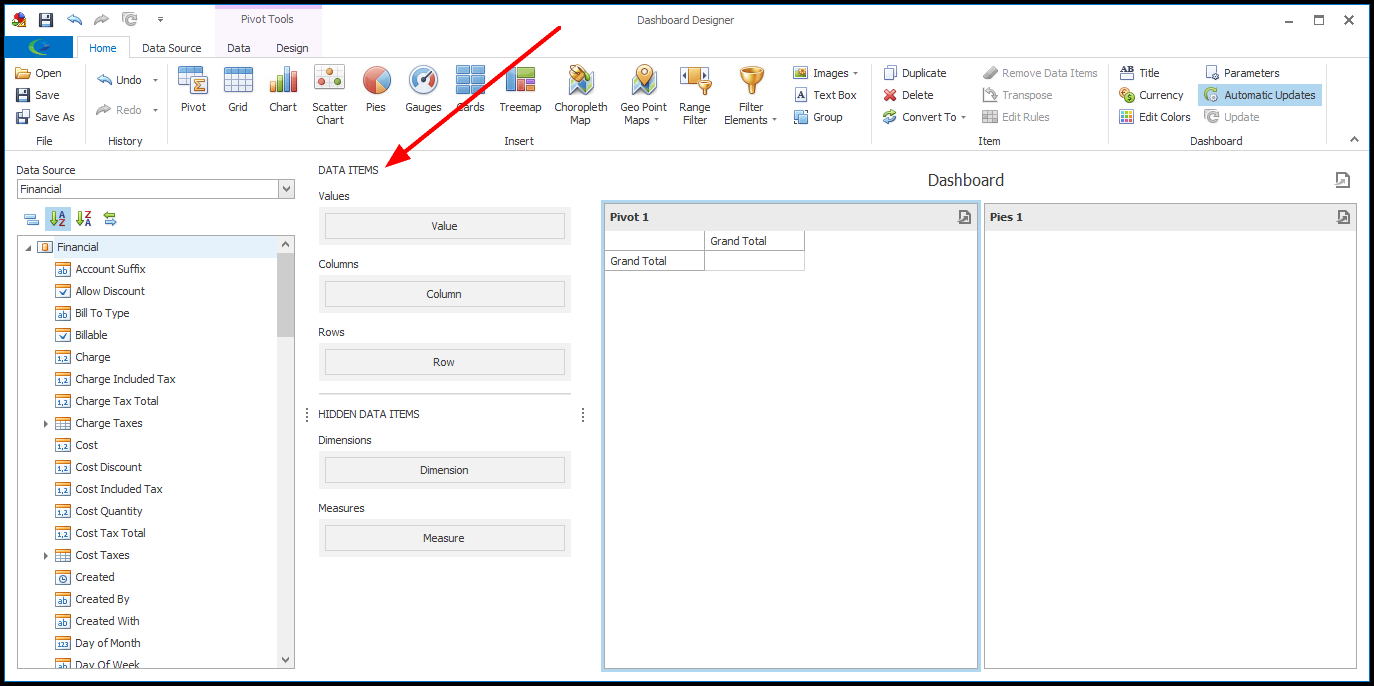
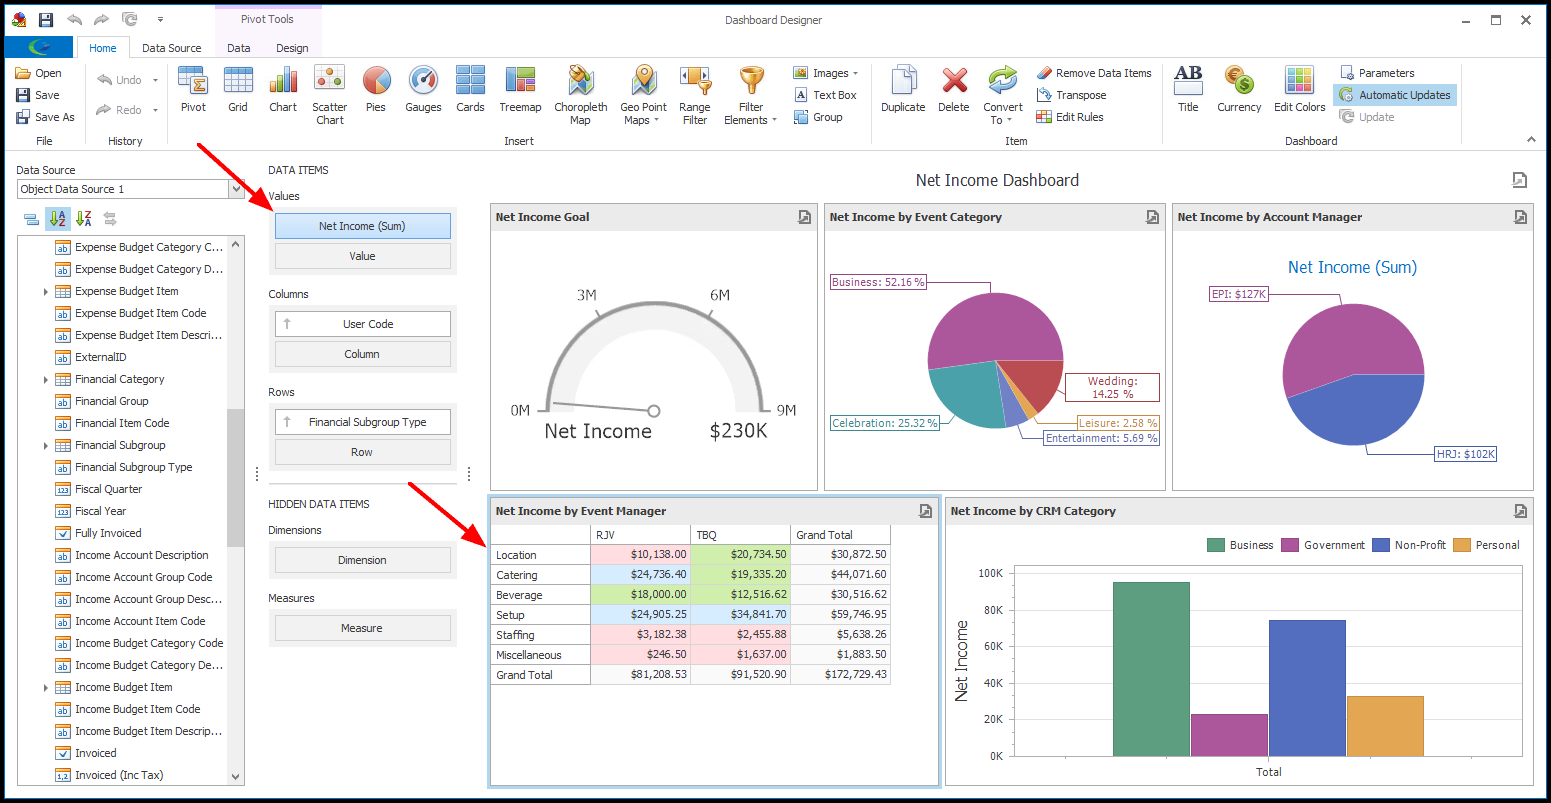
1.When you add an Item to the Dashboard, the DATA ITEMS pane appears in the center, displaying the Data Sections (e.g. Values, Columns, Rows, Arguments, Series, etc.) for the currently selected Dashboard Item, i.e. the Dashboard Item surrounded by the highlighted line.
The available Data Sections will vary, depending on the selected Dashboard Item.
Each type of Dashboard Item has a specific set of data sections. For example, a Pivot Grid has Values, Columns, and Rows, while a Pie Chart has Values, Arguments, and Series.
2.The Data Sections contain individual Data Items.
The Data Items are used to link the Dashboard Item (Pivot/Chart/Pie/etc.) to data source fields, allowing the Dashboard Item to display the data visually.
3.Along the left side of the Designer, you will see the Data Source drop-down. This contains the Data Source, i.e. the "Data Type", you selected earlier.
In our example, we selected Financial. By default, the Data Source will be named something like "Object Data Source 1", but you can Rename the Data Source for clarification.
If you have added more than one Data Source to the Dashboard, you can select a different Data Source from this drop-down.
4.Below the Data Source drop-down is the Data Source Browser, a list of Data Fields from the selected Data Source.
In our example, the Data Source Browser contains Financial fields.
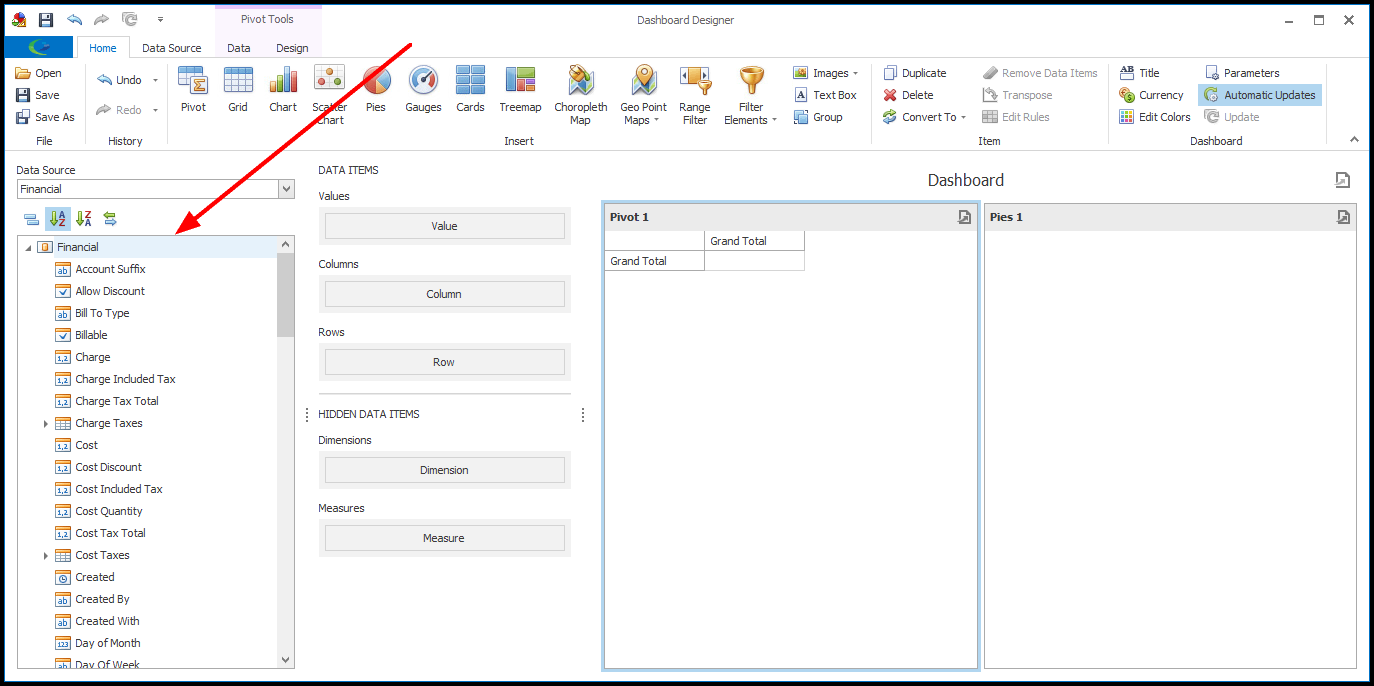
5.Locating Relevant Data Fields: Due to the flexibility and range of Dashboard, there are many data fields available to select.
These are some tips for finding the Data Field you want to use.
a.Using the Group Fields by Type toggle button  above the Data Source Browser, you can group or un-group the fields - whichever helps you locate the relevant field.
b.You can sort the fields using the Sort A-Z or Z-A buttons  .
.
c.You will sometimes need to drill down to find the data field. Click the arrows to expand the fields nested under other fields.
For example, to use the Event Manager data field in a Dashboard Item, you need to drill down to Linked Event > Event Manager > Name (or User Code), and drag-and-drop that Name (or User Code) field onto the correct Data Item.
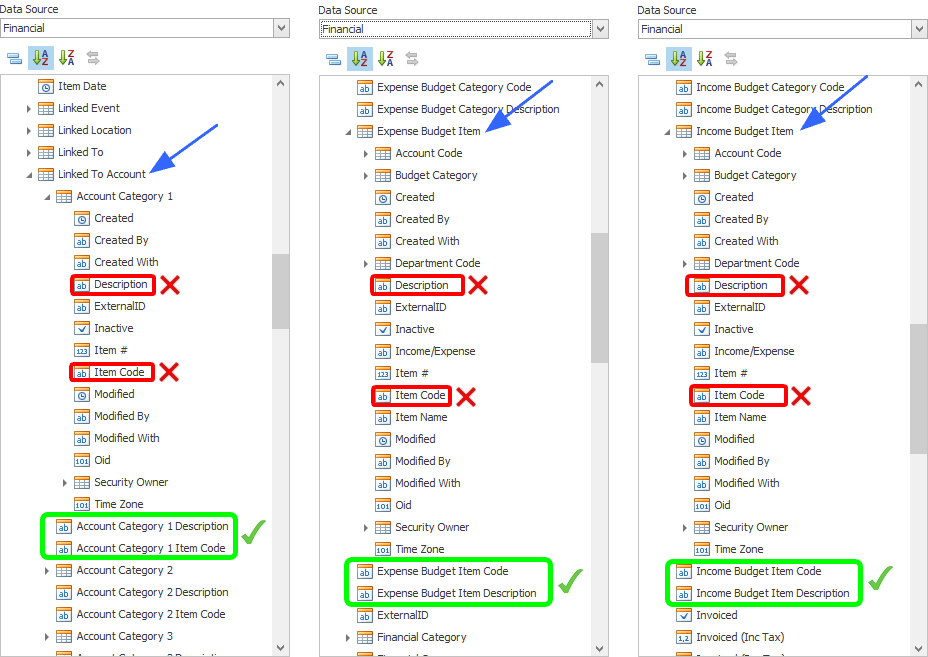
d.IMPORTANT: In order to facilitate faster data retrieval, certain Dashboard fields had to be replaced by specialized fields. These specialized fields were created for Account Categories, Contact Categories, Budget Items, Product Categories, and any other multi-select fields.
For example, when previously adding the Account Category 1 Item Code field to a Dashboard, you would drill down through, for example, Linked to Account > Account Category 1 > Item Code.
Now, there is a specialized field called "Account Category 1 Item Code", so you would only drill down through Linked to Account > Account Category 1 Item Code.
In the Data Source Browser, you will find similar specialized fields for Account Category (1, 2, 3) Item Codes, Account Category (1, 2, 3) Descriptions, Expense Budget Item Codes, Expense Budget Item Descriptions, Income Budget Item Codes, Income Budget Item Descriptions, Contact Category (1, 2, 3) Item Codes, Contact Category (1, 2, 3) Descriptions, Product Category (1, 2) Item Codes, Product Category (1, 2) Descriptions, and any other relevant multi-select fields.
6.To bind a dashboard item to data:
a.Select the Dashboard Item (the relevant Chart/Pie/Pivot/Gauge/etc.).
b.Locate the relevant data field in the Data Source Browser.
c.Drag-and-drop the data field onto the appropriate Data Item in the DATA ITEMS pane.
In our example, we are dragging the Net Income Data Field onto the Value Data Item.
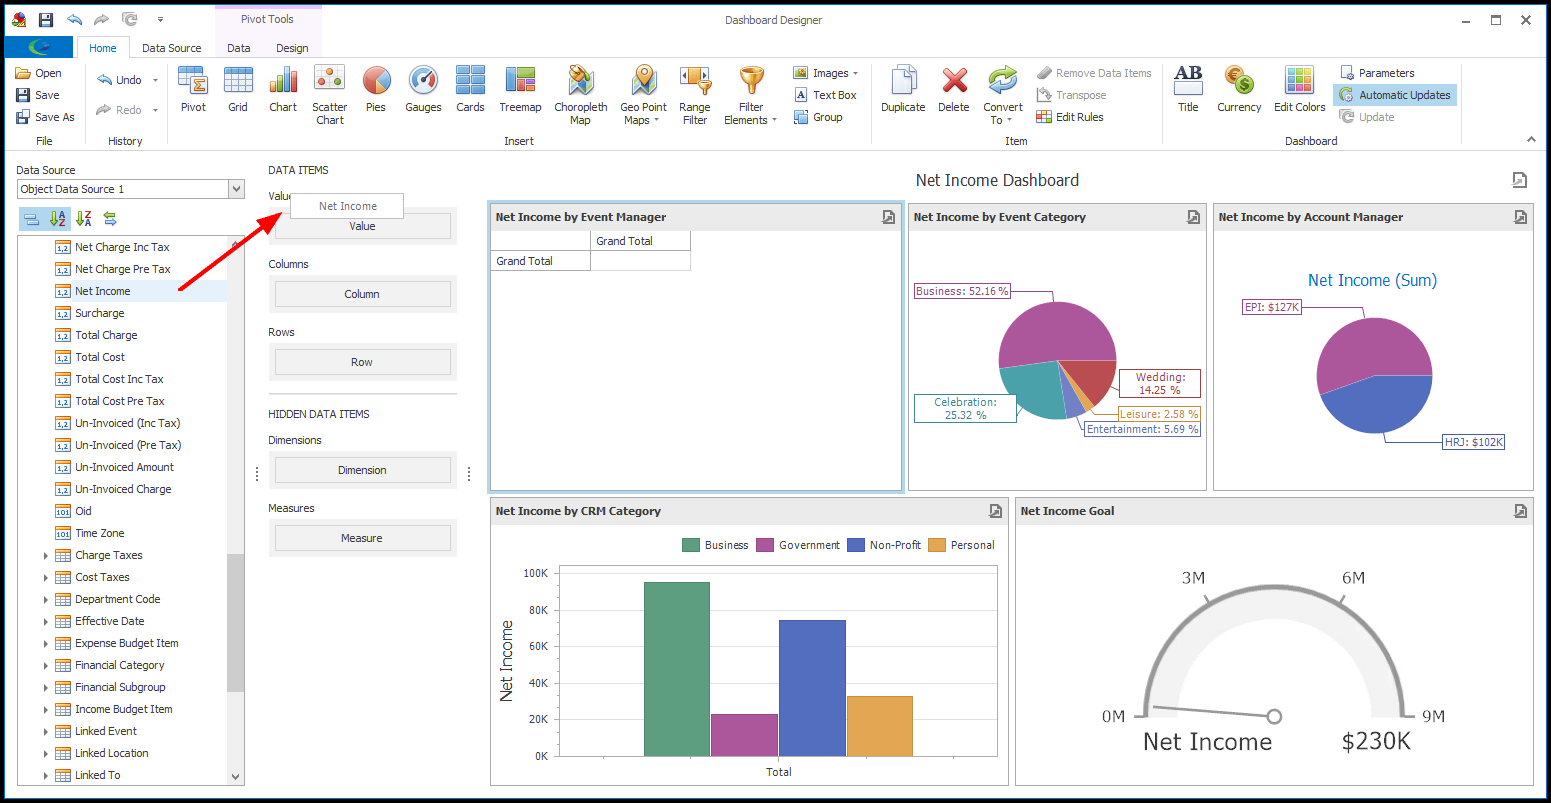
7.After you drop the Data Field onto the Data Item, the Dashboard Item will adjust automatically to display the data you have selected.
Remember that if you entered a limiting number for the Dashboard's Max Records Loaded in Designer setting, this preview in the Dashboard Designer will not look the same as the final Dashboard. The final Dashboard will be pulling data from all relevant records, while the Designer preview is only using the number of records you have indicated. See Dashboard Designer Preview.
8.If you want, you can Rename the Data Item so that it's easier to identify the field.
9.Continue dragging-and-dropping fields onto Data Items as required.
10.If the data isn't displayed quite the way you want, you can modify the data binding.
a.You can drag a field from one Data Item to another.
b.If you have multiple fields under a Data Item, you can drag and drop the fields into a different order.

11.To remove a field from a Data Item, simply drag-and-drop the field back to the Data Source Browser.
12.To remove all Data Items from a Dashboard Item, ensure that the correct Dashboard Item is selected, and click the Remove Data Items button in the top Home ribbon.