1.As you will recall, a Dashboard Item contains Data Items, which are used to bind the Dashboard Item to data source fields.
2.Data Items can process data in two ways, as Dimensions or Measures.
a.Dimension: A Dimension is a data item with values that are not intended to be summarized.
i.For example, dimensions are used for Column and Row headers in Pivot Grids, and for Series and Arguments in Charts/Pies.
ii.Dimension values can be any type: string, date-time or numeric.
iii.Dimensions are used to categorize data. The dashboard does not summarize Dimension values, but groups identical values.
iv.You can group, sort, or display top values for Dimension values, and customize data format settings for numeric and date-time values.
b.Measure: A Measure is a data item with values that are summarized before they are used in the dashboard. Measures are used to summarize data against grouped Dimension values.
i.For example, Measures are used to calculate cell values in Pivot Grids and Charts, and define shares of pie segments in Pies.
ii.Measure values can be any type: string, date-time or numeric.
iii.The dashboard will calculate an appropriate summary function (e.g. Sum, Count, Average, etc.) against Measure values.
iv.You can customize the data format settings that affect how summary values are displayed.
3.This topic looks at "shaping data", referring to operations such as summarizing, grouping, sorting, formatting, displaying Top N, and filtering data in the Dashboard Designer.
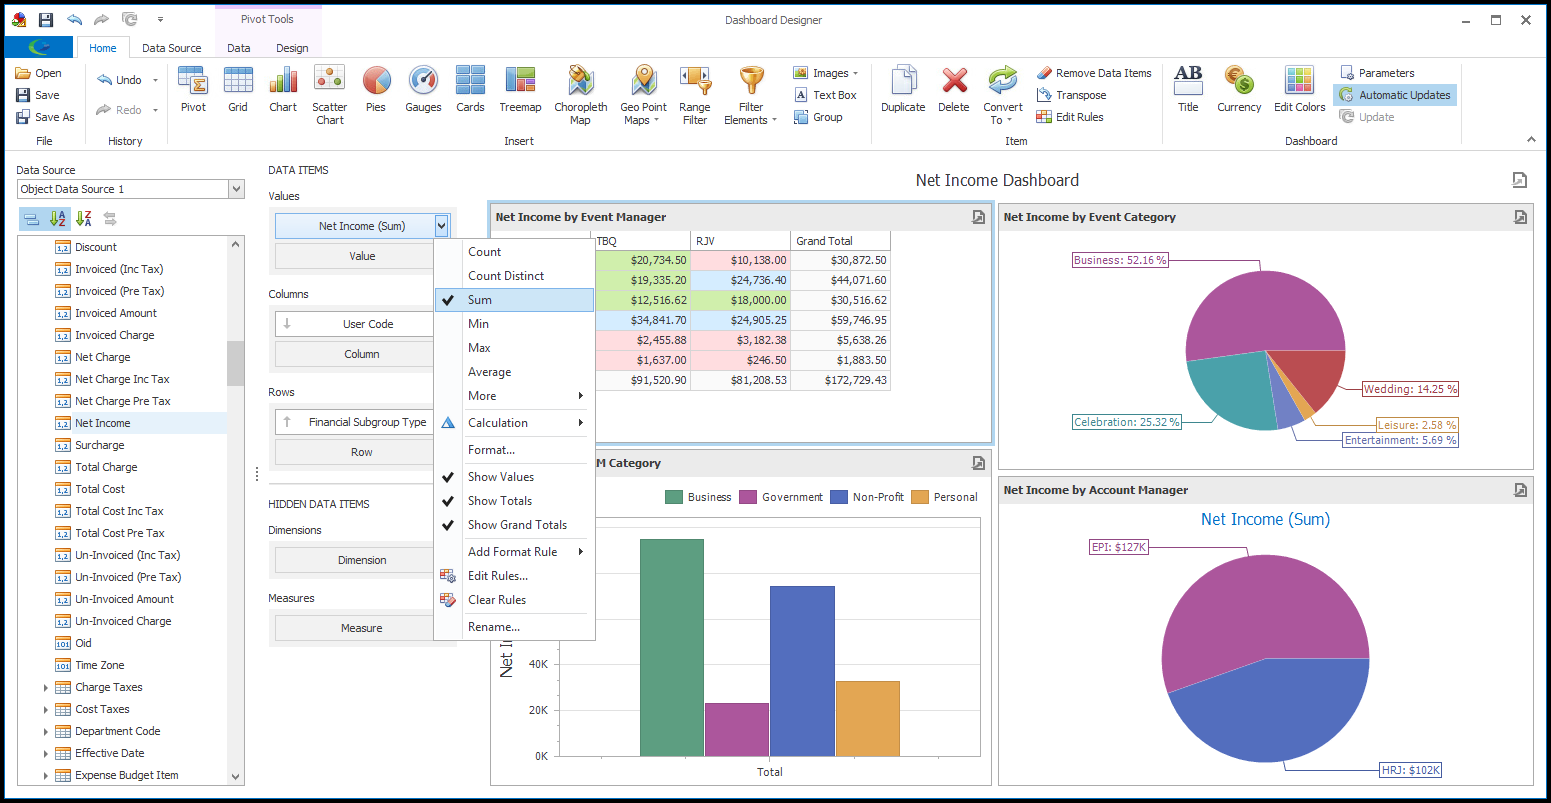
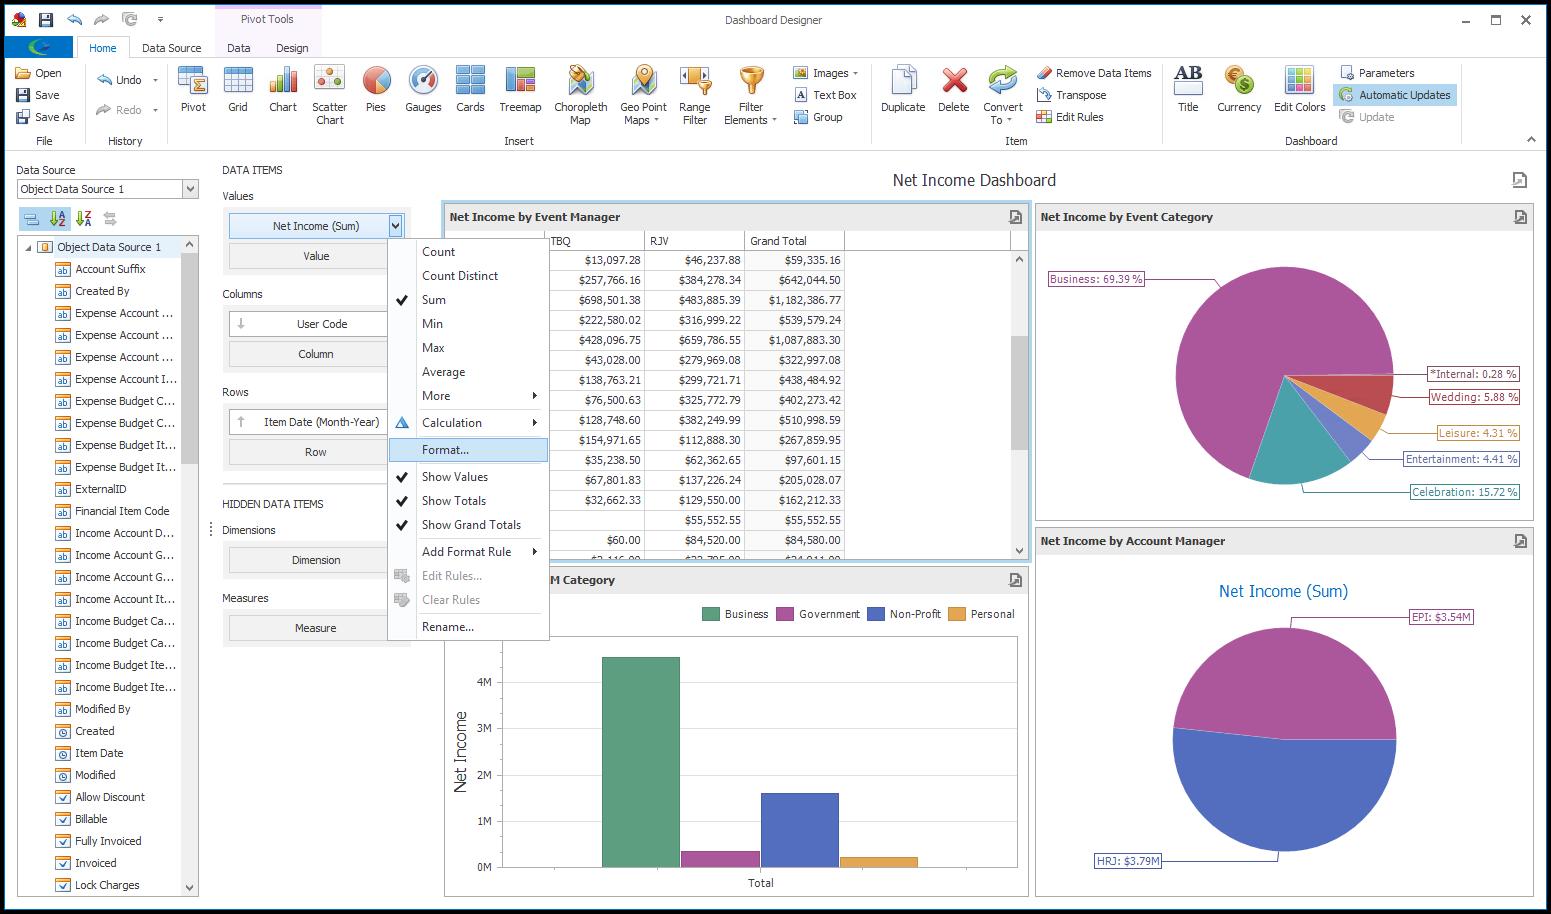
4.Summarizing: Selecting the Summary Function Type for Measure Values
a.To produce the numeric values that are displayed in a Dashboard Item, the dashboard calculates a summary function (e.g. Sum, Count, Min, Max, Average, etc.) against the selected Measure.
b.By default, the dashboard will calculate Sum for numeric measures and Count for other types of data measures, but you can choose a different summary function type.
c.Click the Data Item's menu button - the drop-down arrow on the right side of the field - and select the summary function type you want applied.
The common summary function types appear in the drop-down menu - Count, Count Distinct, Sum, etc. - and other types are available behind the More option.
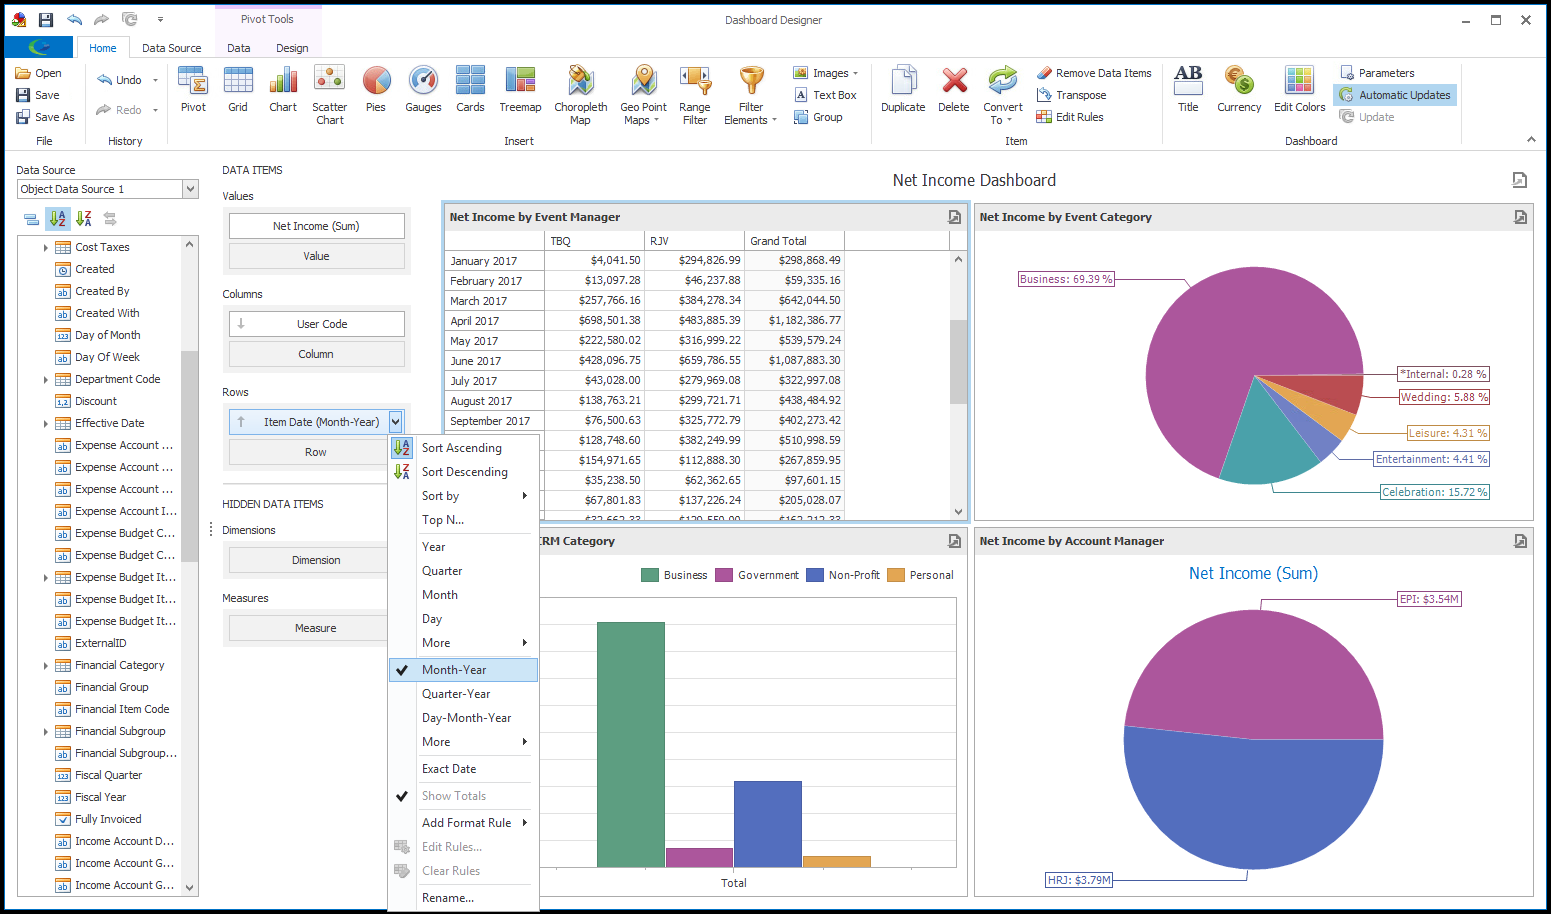
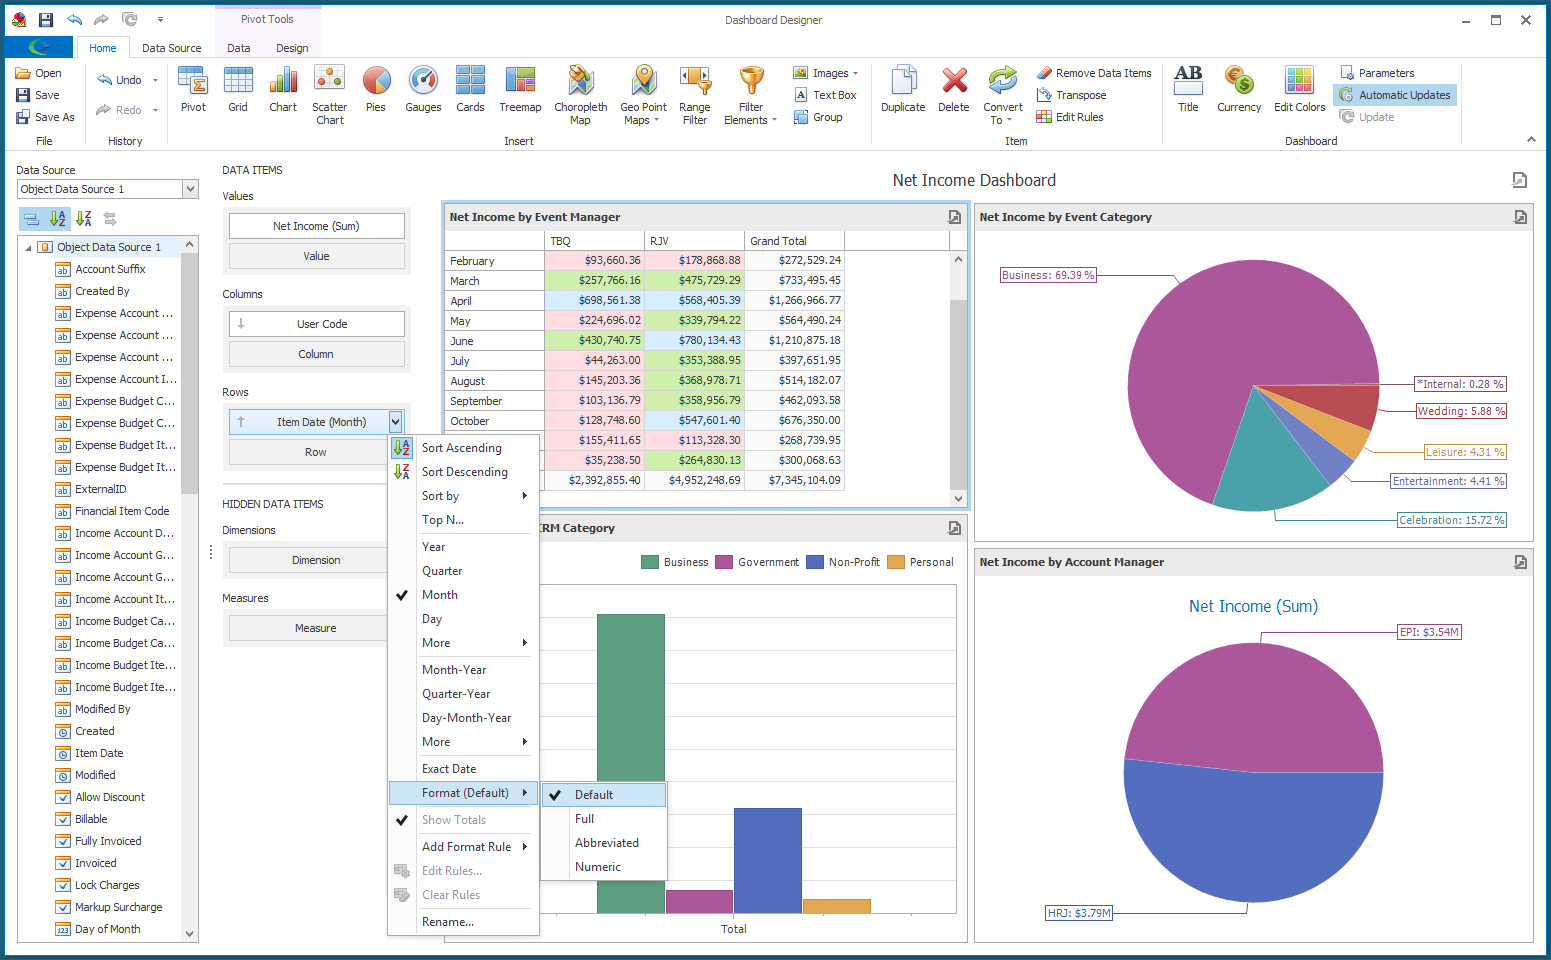
5.Grouping: Specifying Group Interval for Dimension Values
a.You can group dimension values in order to display summaries for groups according to a selected group interval.
b.For example, date values can be grouped by intervals such as Year, Month, etc.
c.To change the group interval, click the Data Item's drop-down menu button and select the group interval you want to use, e.g. Year, Quarter, Month, Day, Month-Year, Quarter-Year, etc.
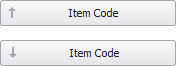
6.Sorting: Changing the Sort Order of Dimension Values
a.The sort order direction of a dimension value is indicated by the small arrow on the left side of the data item.
b.You can reverse the sort order by clicking on the data item.
c.You can choose Sort Ascending or Sort Descending from the data item's drop-down menu, as well.
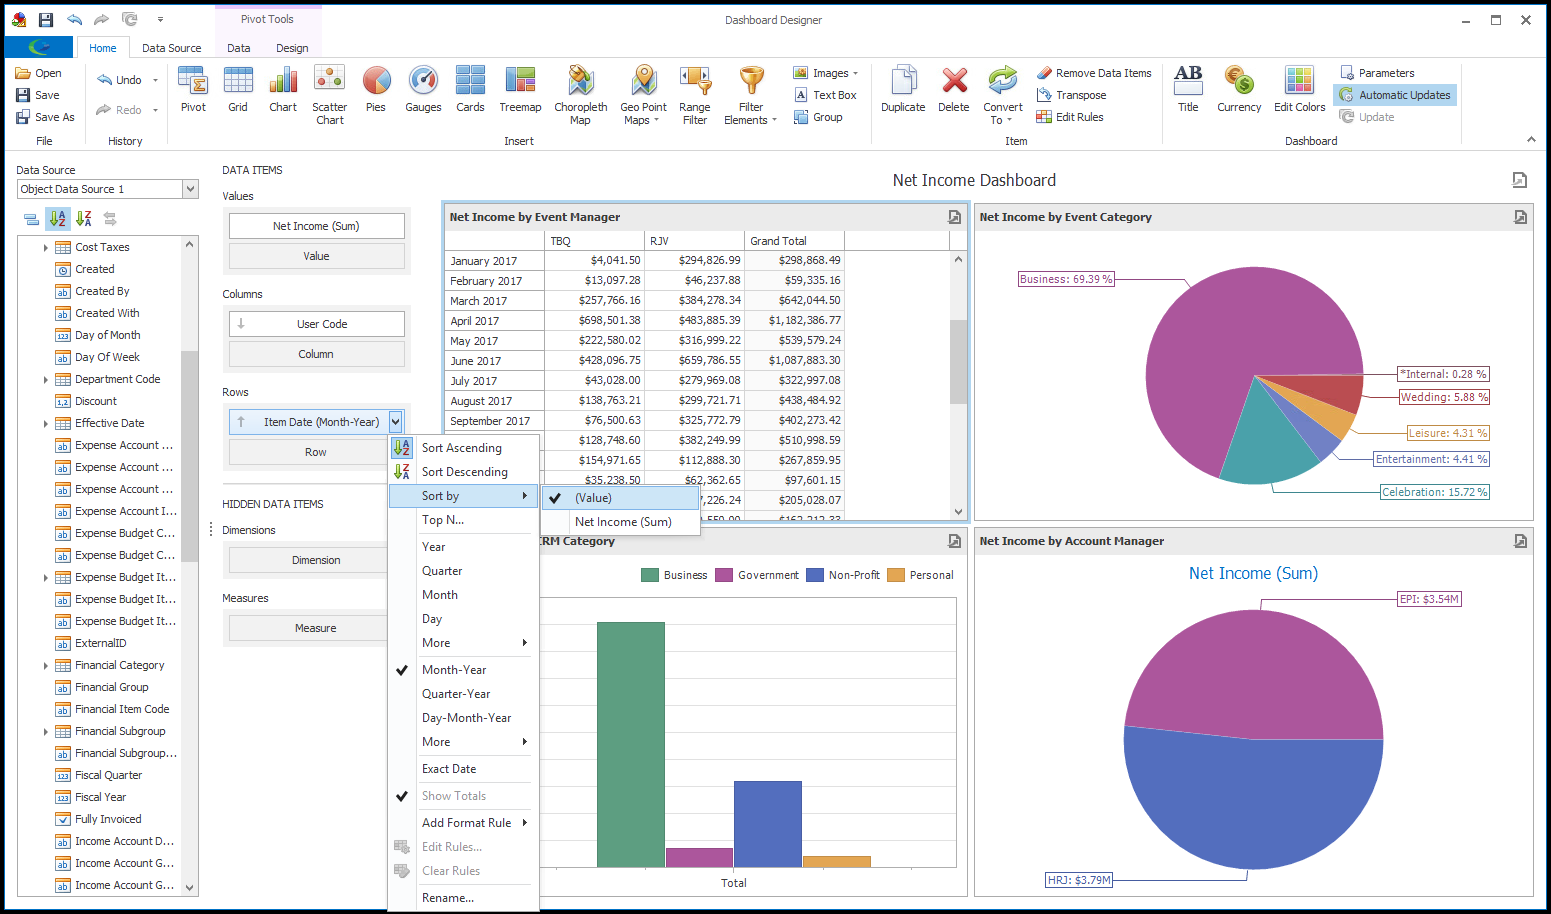
d.You can also sort Dimension values by Measure values.
Using the data item's drop-down menu, go to the Sort By sub-menu and select an option.
7.Formatting: Setting the Format for Numeric and Date-Time Values
a.To specify the format for numeric values, click the Data Item's drop-down menu button and select Format.
i.The Numeric Format edit form appears.
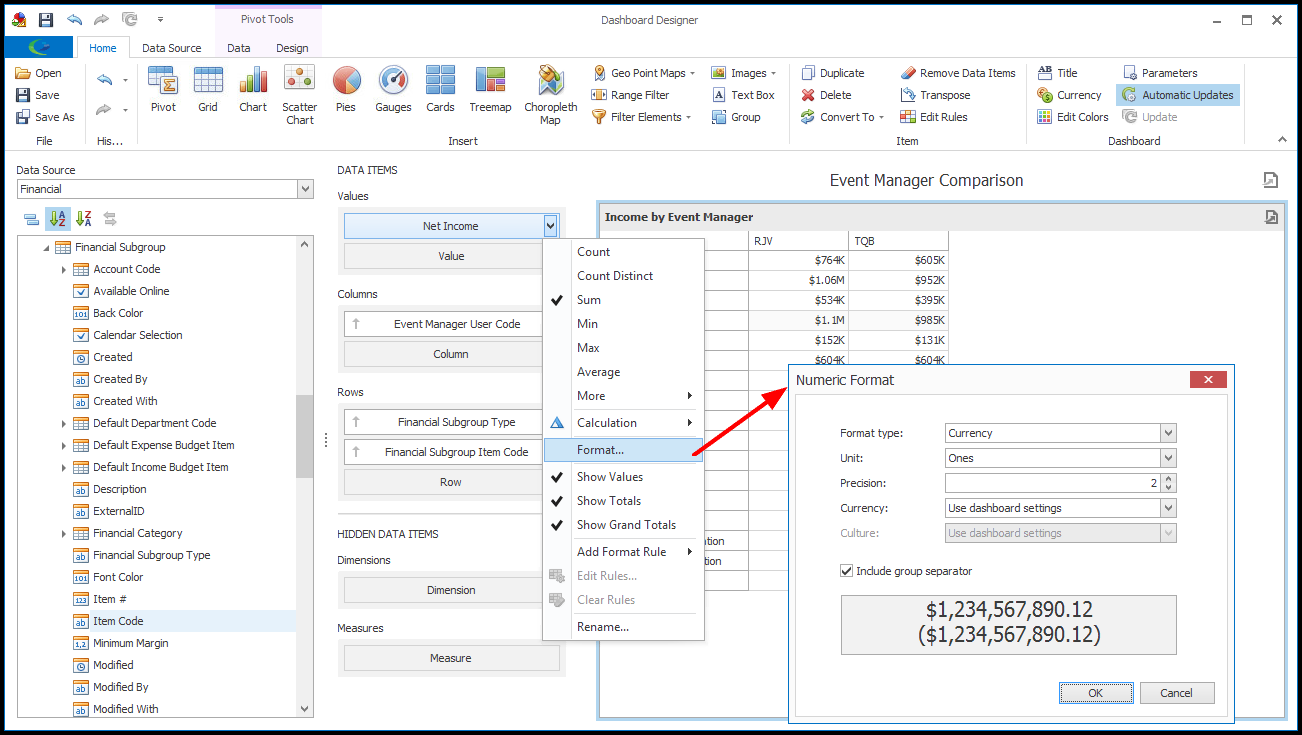
ii.Select the options you want to apply to the values.
iii.For example, if you don't want to use the default abbreviated Currency Format (e.g. $24K) and would prefer the full numbers to appear (e.g. $24,000.00), you can change the Currency format settings:
Format Type: Currency
Unit: Ones
Precision: 2 (decimal places)
Currency: Use Dashboard Settings (The Dashboard Currency is set using the Currency command in the Dashboard section of the Home ribbon, described below.)
Include Group Separator: Yes
iv.When you are done making changes in the Numeric Format edit form, click OK.
b.To specify the format for date-time values, click the Data Item's drop-down menu button and select an option from the Format sub-menu.
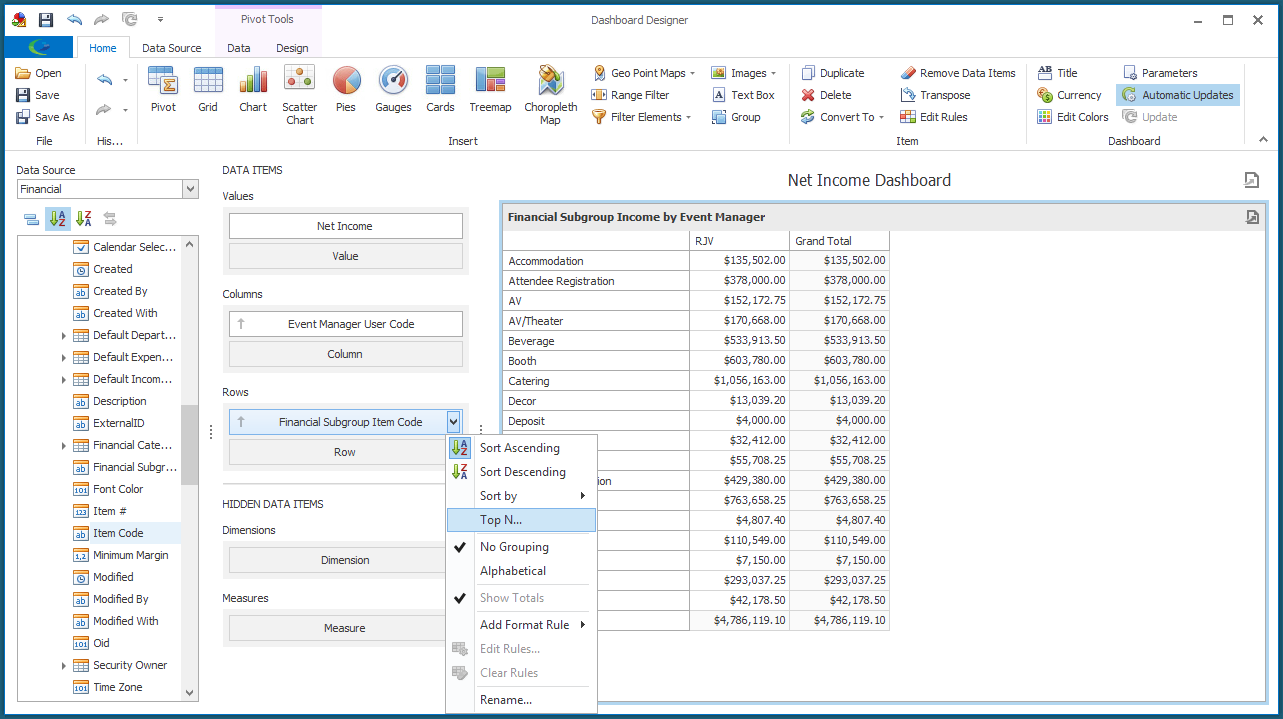
8.Displaying Top N: Display Only Highest or Lowest Values for a Measure
a.This feature allows you to limit the values displayed to a specified number of the highest or lowest values of a given Measure.
b.Select Top N from the Data Item's drop-down menu.
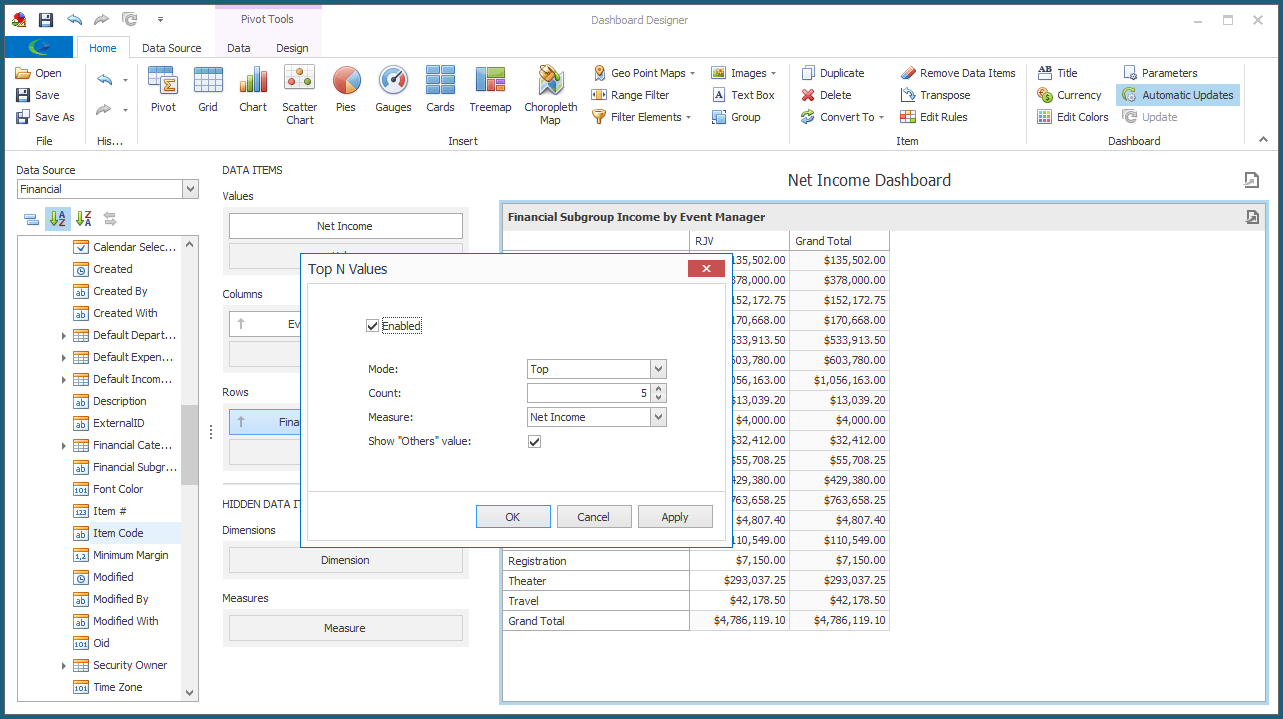
c.In the Top N Values dialog, make your selections.
i.Enabled: Select this checkbox to activate Top N functionality.
ii.Mode: Choose whether you want to display only Top (highest) values or Bottom (lowest) values.
iii.Count: Indicate the number of Top or Bottom values to be displayed.
iv.Measure: Select the Measure by which Top or Bottom values are determined.
v.Show "Others" Value: Select this checkbox to have all non-Top/Bottom values consolidated into and displayed as an "Others" value.
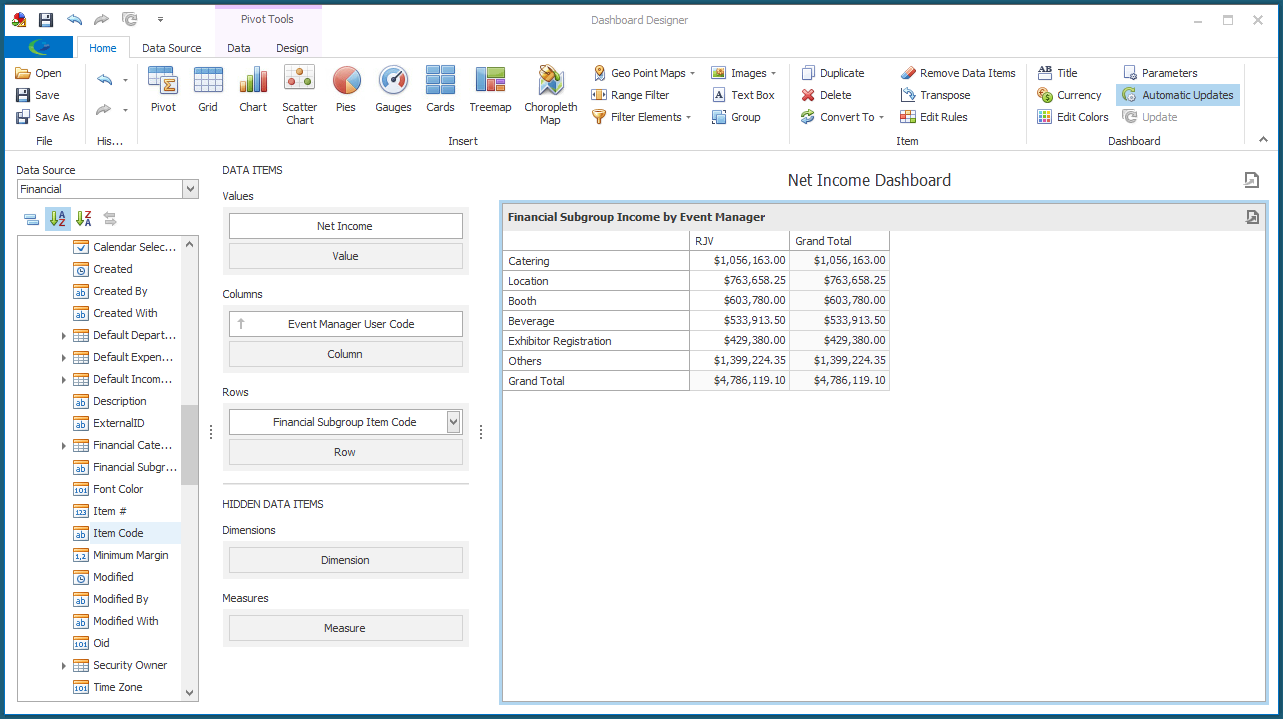
d.Click OK. The Top N feature will be applied.
e.To clear the Top N, go back to the Top N Values dialog, unselect the Enabled checkbox, and click OK.
9.Filtering: Apply Filter to Data Source or Dashboard Item
a.You can filter at the Data Source level for the entire Dashboard, or at the individual Dashboard Item level.
b.To filter the Data Source:
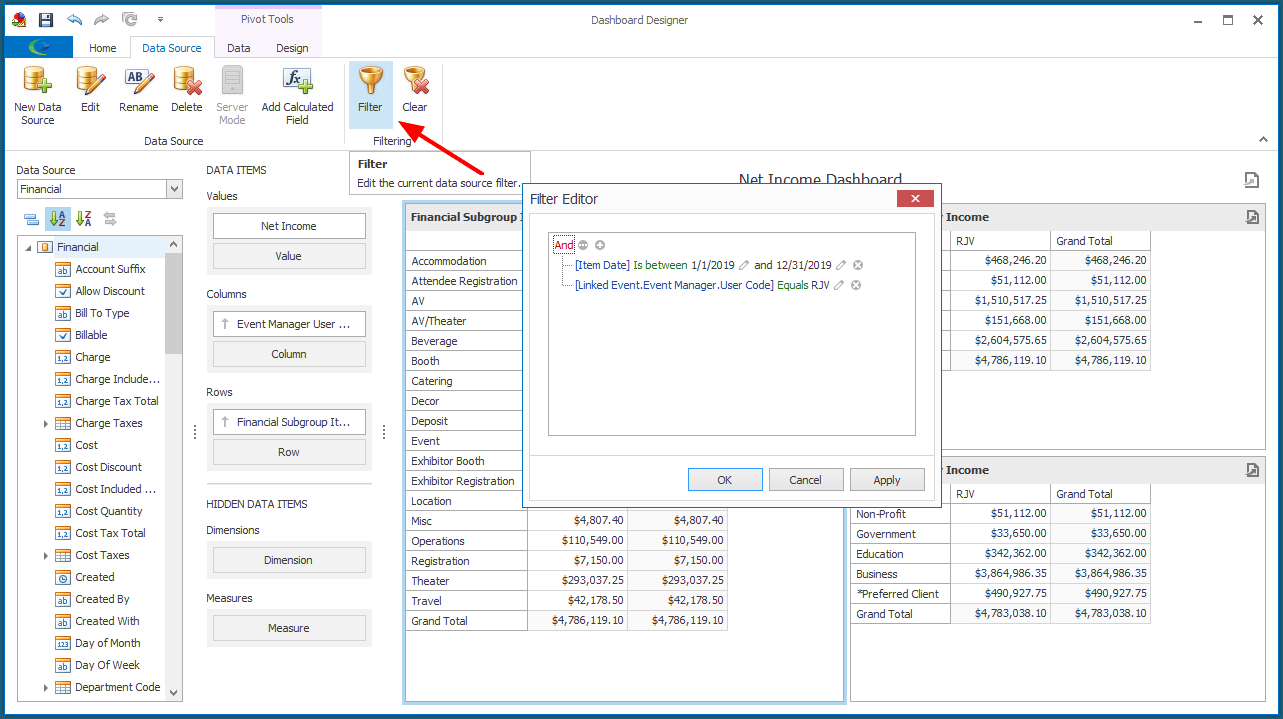
i.Go to the Data Source tab in the top ribbon of the Dashboard Designer, and click the Filter button.
ii.The Filter Editor dialog appears. Set the filter criteria as you require. You can review the general functions of a Filter Editor under Common Procedures | Construct Filters.
Click Apply to update and view the filtered data in the background. When you are satisfied with the filter settings, click OK.
iii.To clear the Data Source filter, return to the Data Source tab, and click the Clear button.
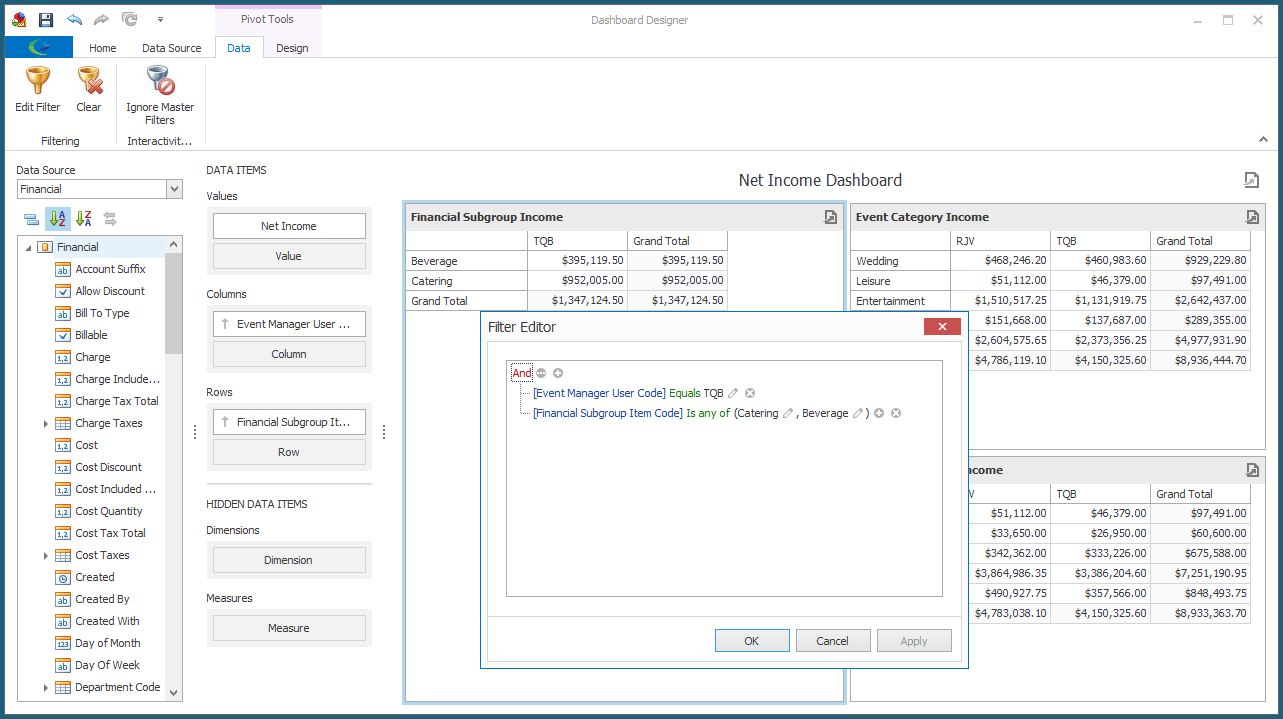
c.To filter a Dashboard Item:
i.Select the relevant Dashboard Item.
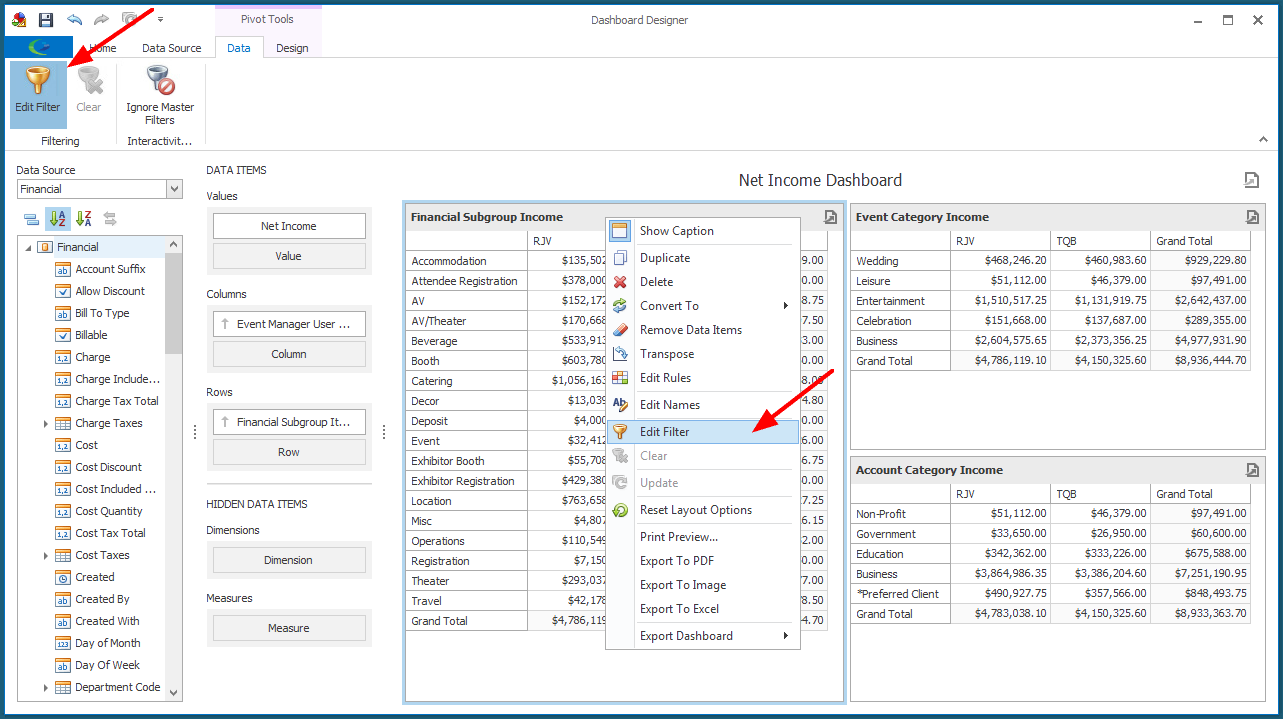
ii.Go to its Data tab in the top ribbon, and click Edit Filter. You can also right-click the Dashboard Item, and select Edit Filter from its speed menu.
iii.The Filter Editor dialog appears. Set the filter criteria as you require. You can review the general functions of a Filter Editor under Common Procedures | Construct Filters.
Click Apply to update and view the filtered data in the background. When you are satisfied with the filter settings, click OK.
iv.To clear the Dashboard Item's filter, return to its Data tab in the top ribbon, and click Clear, or right-click the Dashboard Item, and select Clear from its speed menu.