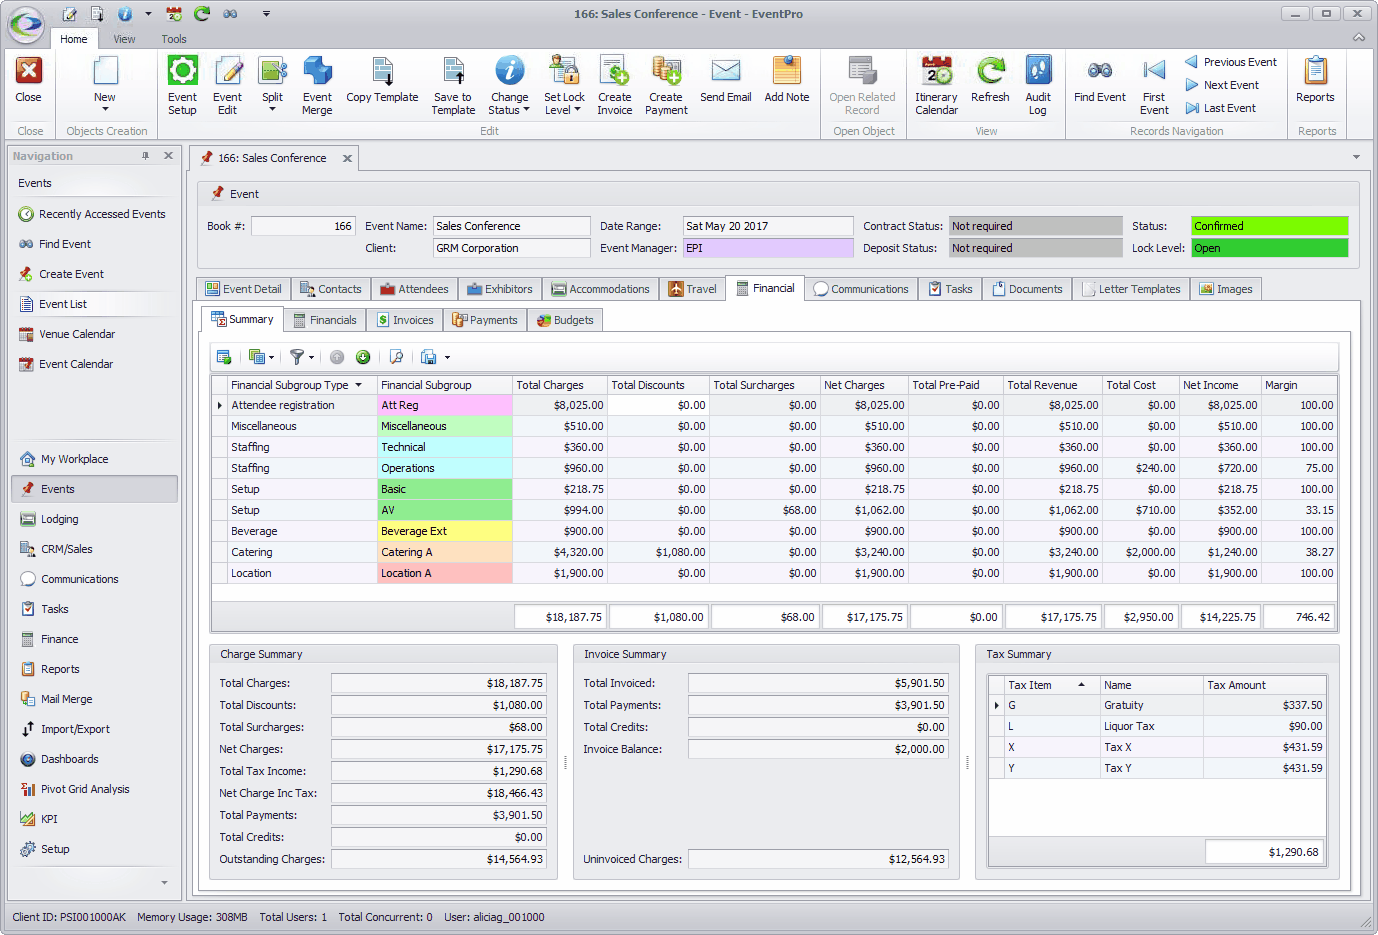
The Event Financial Summary displays the total Charges, Discounts, Surcharges, Cost, Revenue, Margin, and other financial totals for an Event, broken down by Financial Subgroup.
The totals in the Summary are automatically updated as items are added, removed and edited in the Event.
•Viewing your event in the Event screen, click on the Financial tab and select the Summary sub-tab.
•Each row in the selection grid represents a Financial Subgroup, so you can view the various totals (Total Charges, Total Revenue, etc.) for a Financial Subgroup by following that row to the right and viewing the value under each financial column. Note that a Financial Subgroup will only appear in the Summary if items from that Financial Subgroup have been added to the Event.
•The financials totals for the Event - adding together all Financial Subgroups - appear at the bottom of each column.
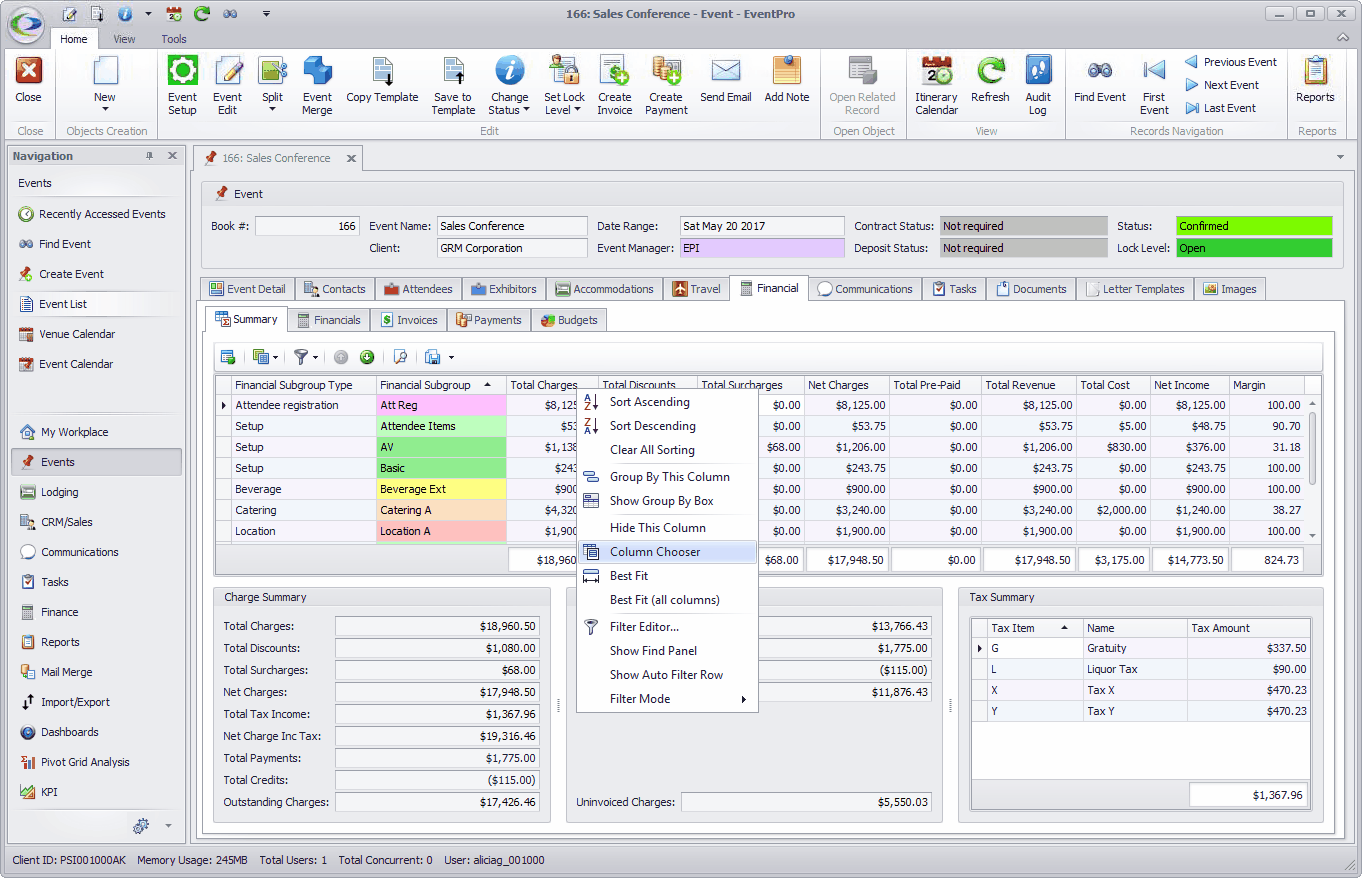
•Remember that you can sort and move columns in a selection grid; review Sort Records by Column, and Resize & Move Columns.
•If the selection grid does not display a field you wish to view, remember that you can add columns to a grid; review Choose and Hide Columns.
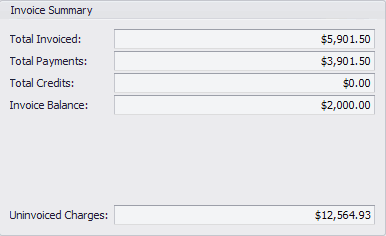
•Three Summary boxes appear in the bottom half of the screen, below the selection grid: Charge Summary, Invoice Summary and Tax Summary.
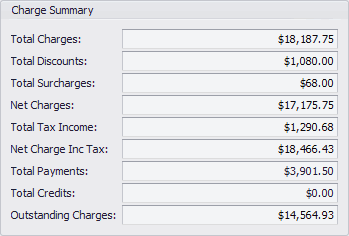
oThe Charge Summary displays Total Charges, Total Discounts, Total Surcharges, Net Charges, Total Tax Income, Net Charge Inc Tax, Total Payments, Total Credits, and Outstanding Charges for the Event.
oThe Invoice Summary displays Total Invoice, Total Payments, Total Credits, Invoice Balance, and Uninvoiced Charges for the Event.
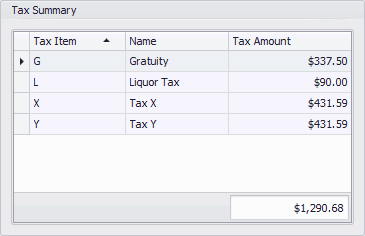
oThe Tax Summary displays the Tax Amount for each type of applicable Tax, and the Total Tax Amount for the Event.