Now that you have created KPI Definitions, you need to collect them together in a way that is useful for visualizing and comparing the data they provide. For that, we will use KPI Scorecards.
In our earlier example, we created Monthly and Yearly KPI Definitions that tracked Total Charges for each Financial Subgroup Type. We will now put those definitions together in scorecards.
1.Begin in the KPI Scorecard area.
2.Start a New KPI Scorecard record.
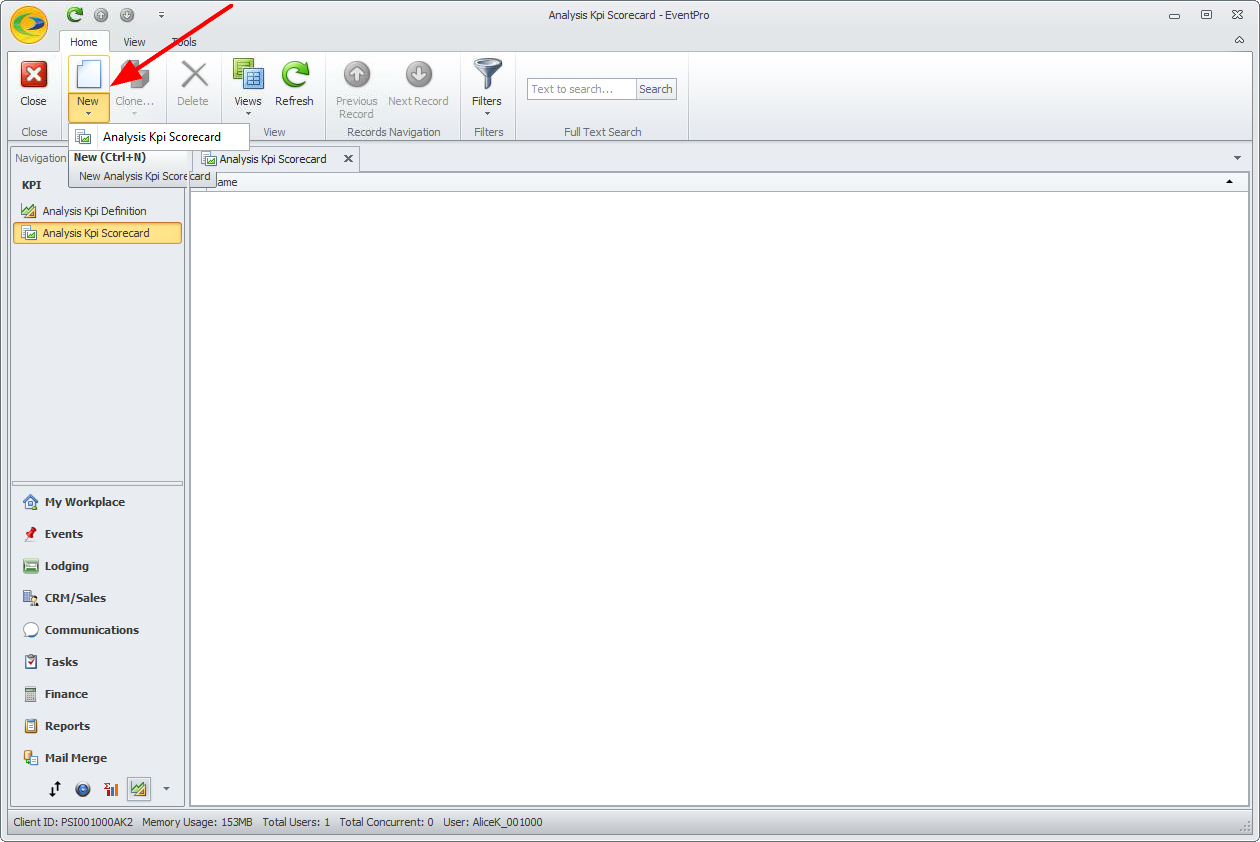
3.The KPI Scorecard edit form opens.
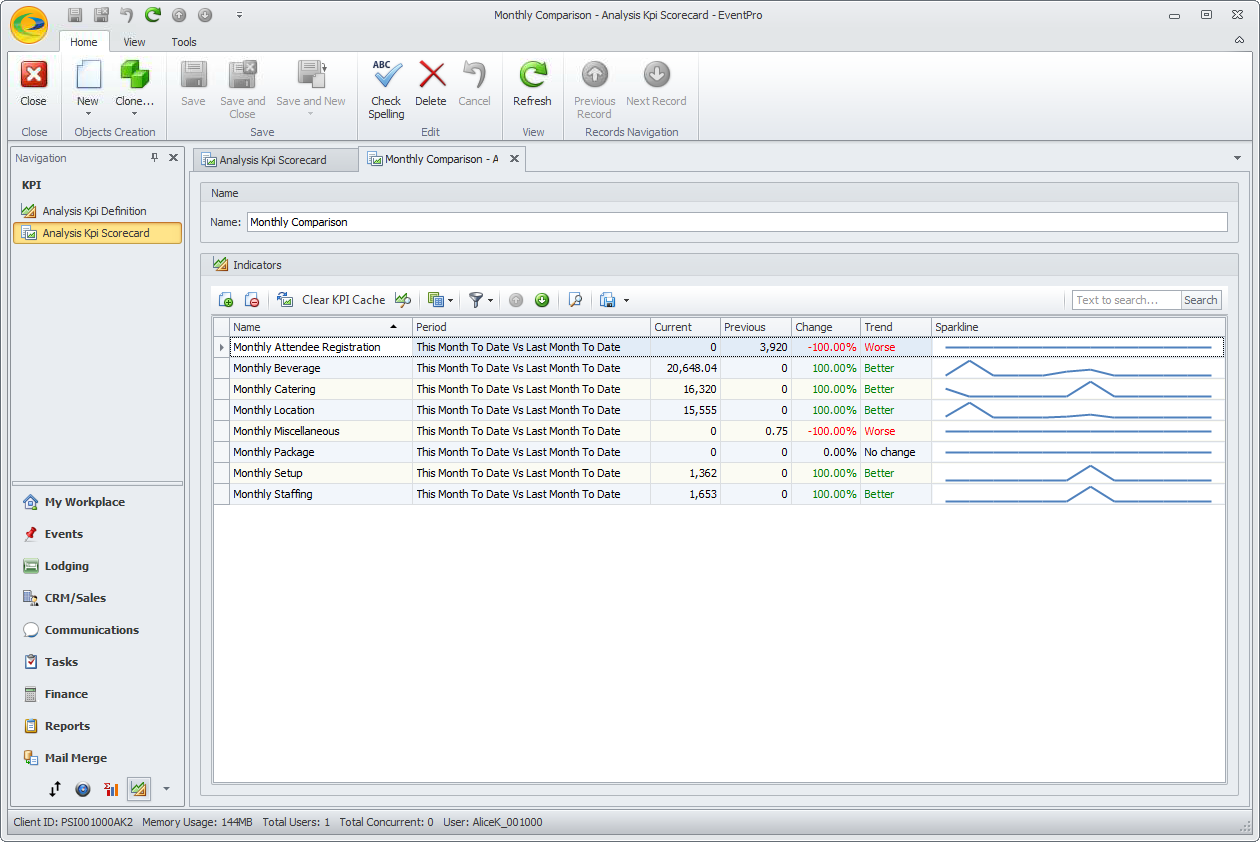
4.Type in the Name of the Scorecard. In our example, we are going to look at all the KPIs for Monthly Financial Subgroup Type Charges, so we could call our Scorecard something like Monthly Financial Subgroup Type Total Charge Comparison. Choose a name that clearly describes the purpose of your scorecard.
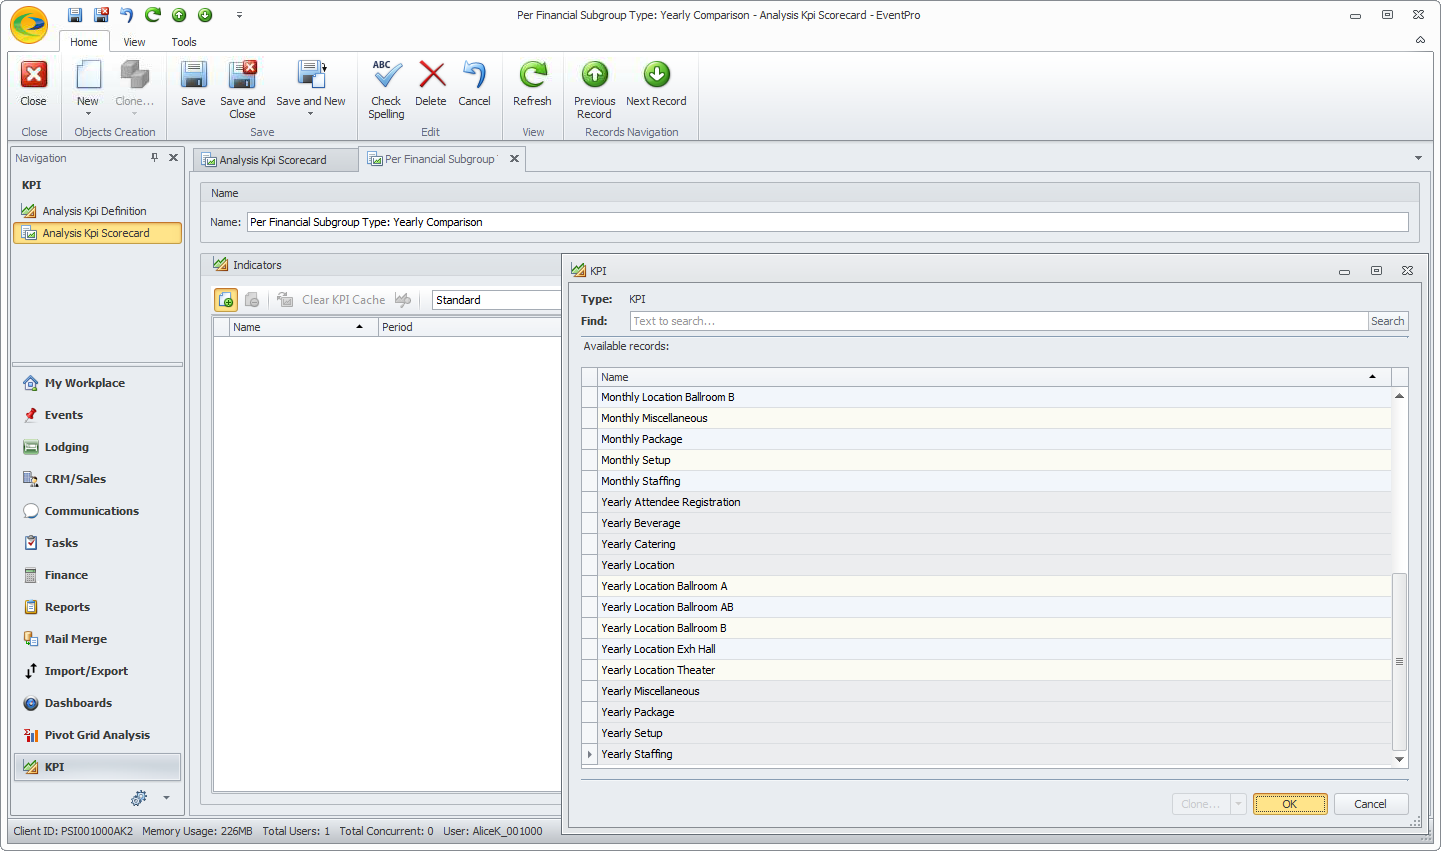
5.Click the Link button  in the Indicators section.
The KPI window opens, displaying all of your existing KPI Definitions.
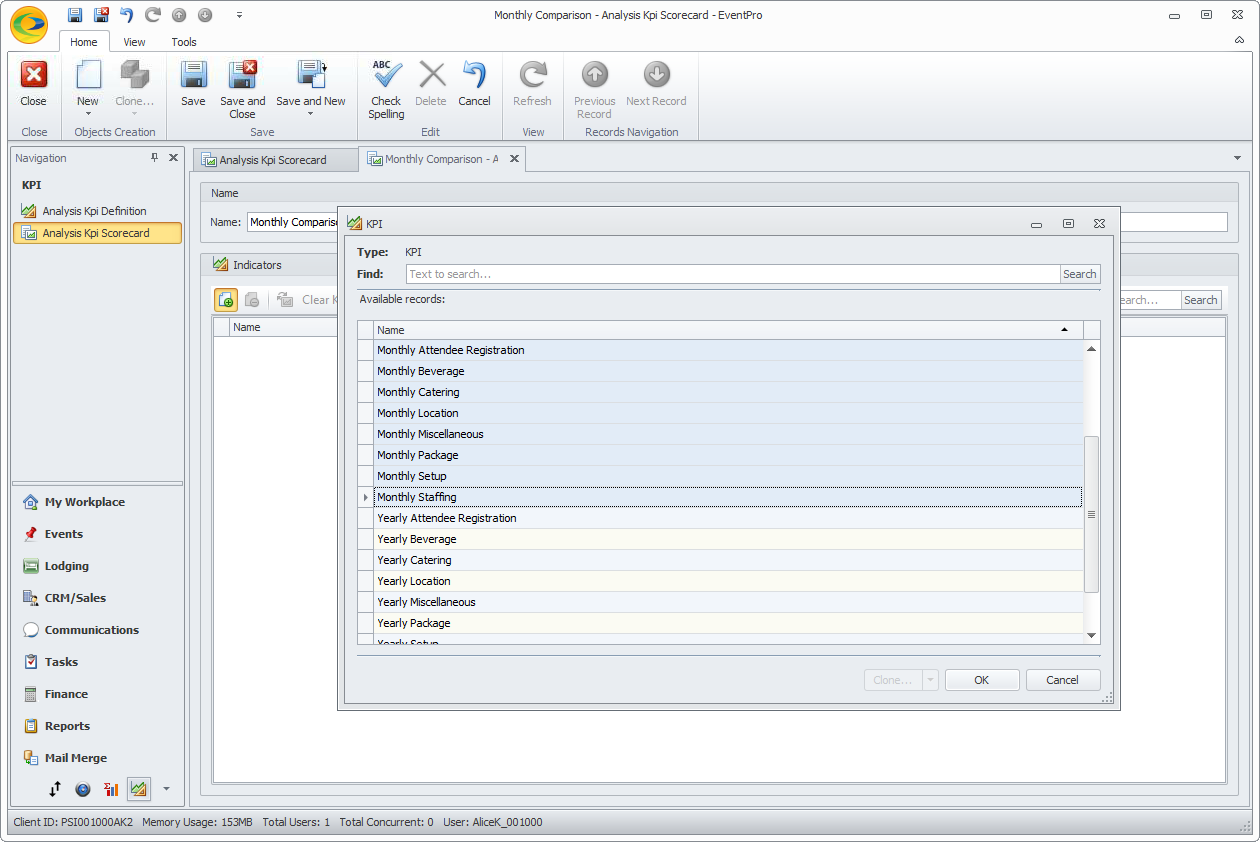
6.Select the KPI Definitions you want to add to the scorecard. To multi-select, hold down the Ctrl key and click on all the relevant records.
Click OK.
7.The KPI Definitions will be linked to the scorecard, where you can view the Current value, Previous value, Change percentage, Trend, and Sparkline for each Monthly Financial Subgroup Type Total Charge.
The Sparkline displays the variations that have occurred in the current Month to Date. As noted above, more frequent measurements make a more detailed sparkline, while less frequent measurements will show a more general trend.
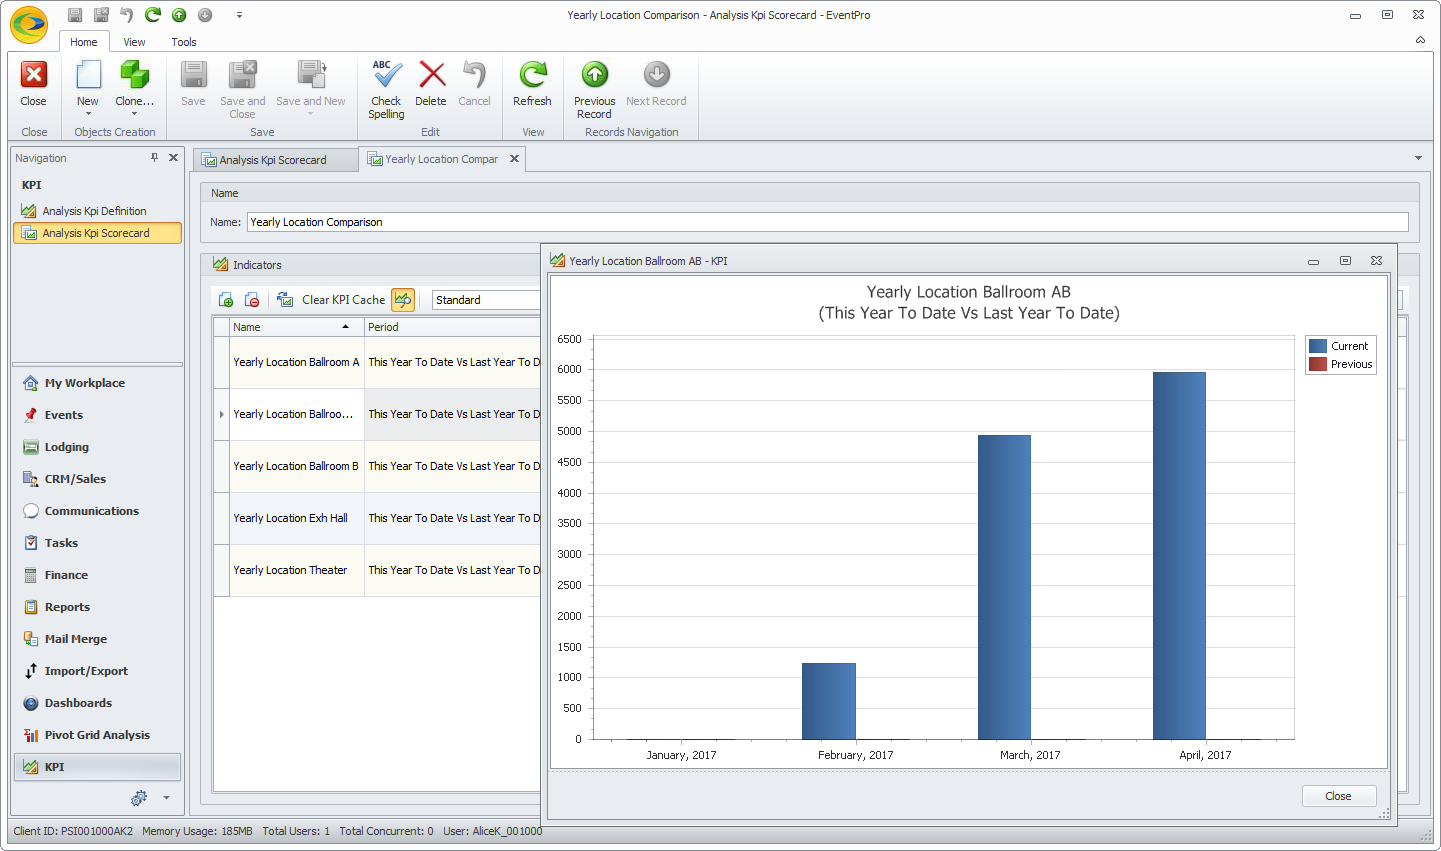
8.If you want to view the Sparkline in chart format, select the KPI record in the grid and click the Show Chart button  above.
The chart will open in a separate window. Click the X in the upper right corner to close the chart when you are done viewing it.
9.When you are done, Save and Close the Monthly Comparison Scorecard.
10.We will now create a second Scorecard, this time for the Yearly Comparison.
11.Start a new Scorecard record. Enter the name (e.g. Financial Subgroup Type Charges Yearly Comparison), and link the relevant Yearly KPI Definitions.
You can now view the Current value, Previous value, Change percentage, Trend, and Sparkline for each Yearly Financial Subgroup Type Total Charge.
The sparkline displays the variations that have occurred in the current Year to Date.
12.Save and Close the Yearly Comparison Scorecard.