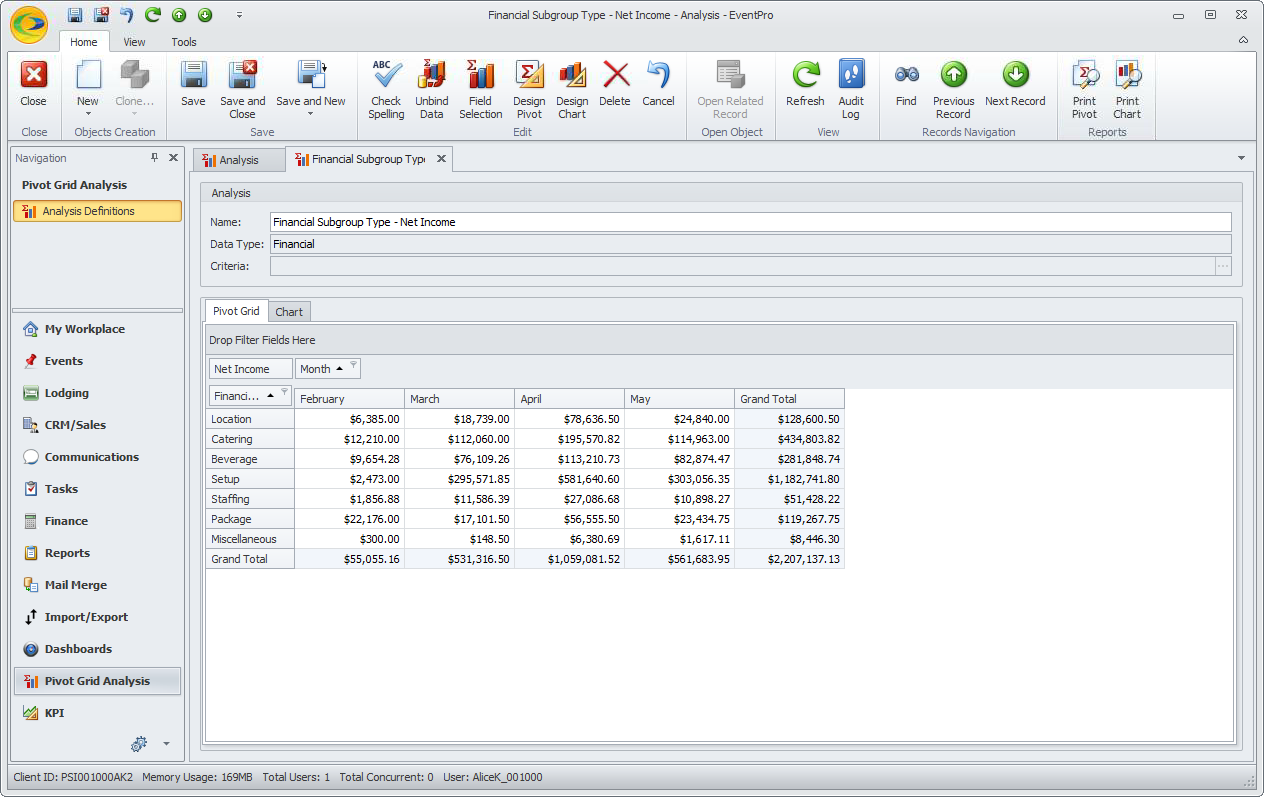
•A Pivot Grid summarizes a large amount of data and displays it in a cross-tabulated form, meaning that the column headers display values from one data field, and rows headers display values from another data field. Each grid cell displays a summary for the intersecting row and column, allowing you to analyze the relationship between the groups of data.
•The layout of an EventPro Pivot Grid can be easily customized by dragging-and-dropping fields into different locations, e.g. moving fields from row to column, or column to row, or changing position in relation to other fields. The Pivot Grid will automatically re-summarize the data, allowing you to view the information from a new and different perspective.
•There are built-in functions that allow you to quickly sort and filter data on the Pivot Grid so that it shows the information you want in a streamlined, non-cluttered fashion.
•If you want a better visualization of the data, you can use integrated Charts to display the summarized information in a variety of formats, including bar graphs, stacked bar graphs, pie charts, line graphs, and many more, in any almost color scheme you prefer.
•The Pivot Grid designer is extremely flexible and comprehensive, so it is almost impossible to describe every variation of data source, layout, filtering, and sorting that could be used. We will provide some common examples of cross-tab Pivot Grids that you may want to try, and later customize to your organization's needs.
•When you are ready to start defining Pivot Grids, follow the instructions below: