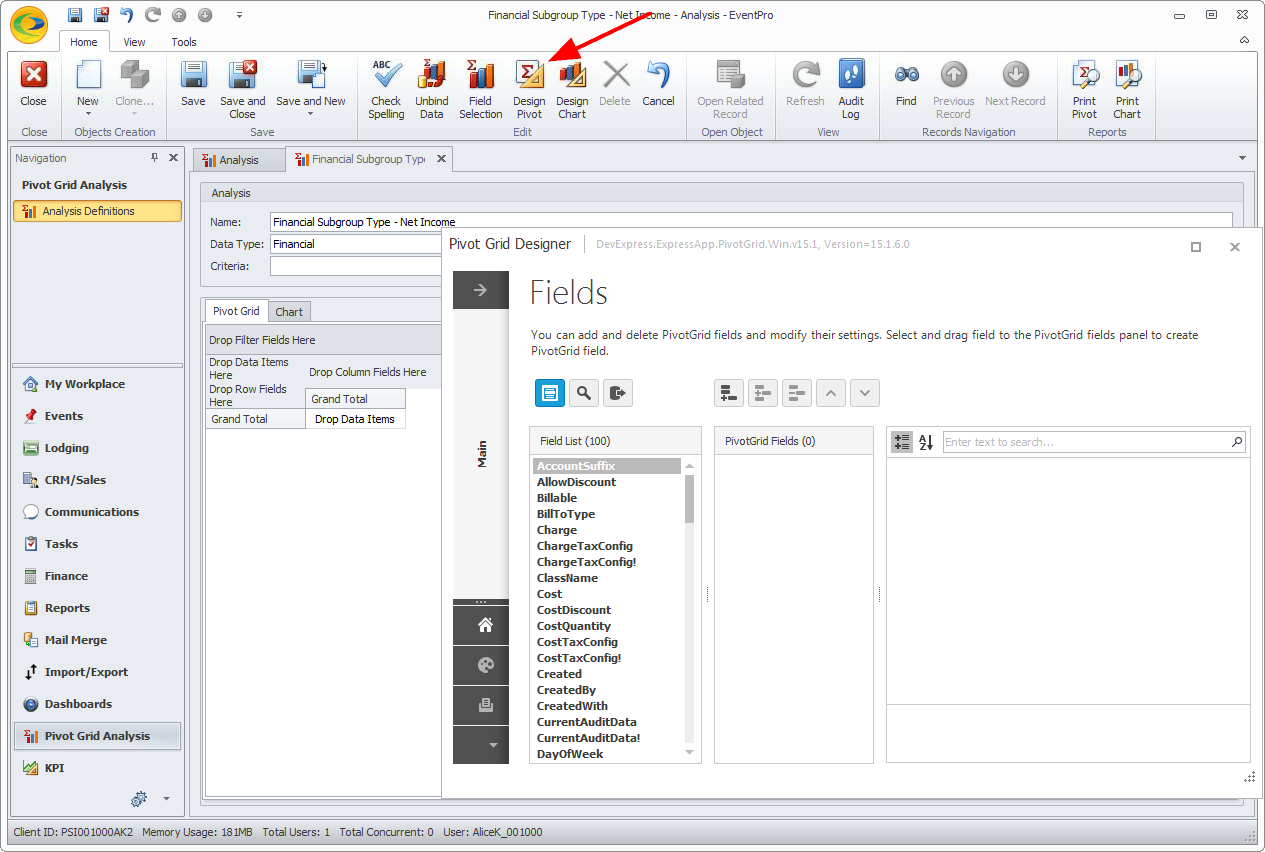
1.After binding the data, click the Design Pivot button.
The Pivot Grid Designer opens.
2.In the Pivot Grid Designer, you will select the fields that you want to use in the Pivot Grid.
a.The Field List displays the fields available in the data source you selected.
Scroll through the field list to find the fields you want.
b.Drag and drop each field you want to use onto the Pivot Grid Fields area in the middle.
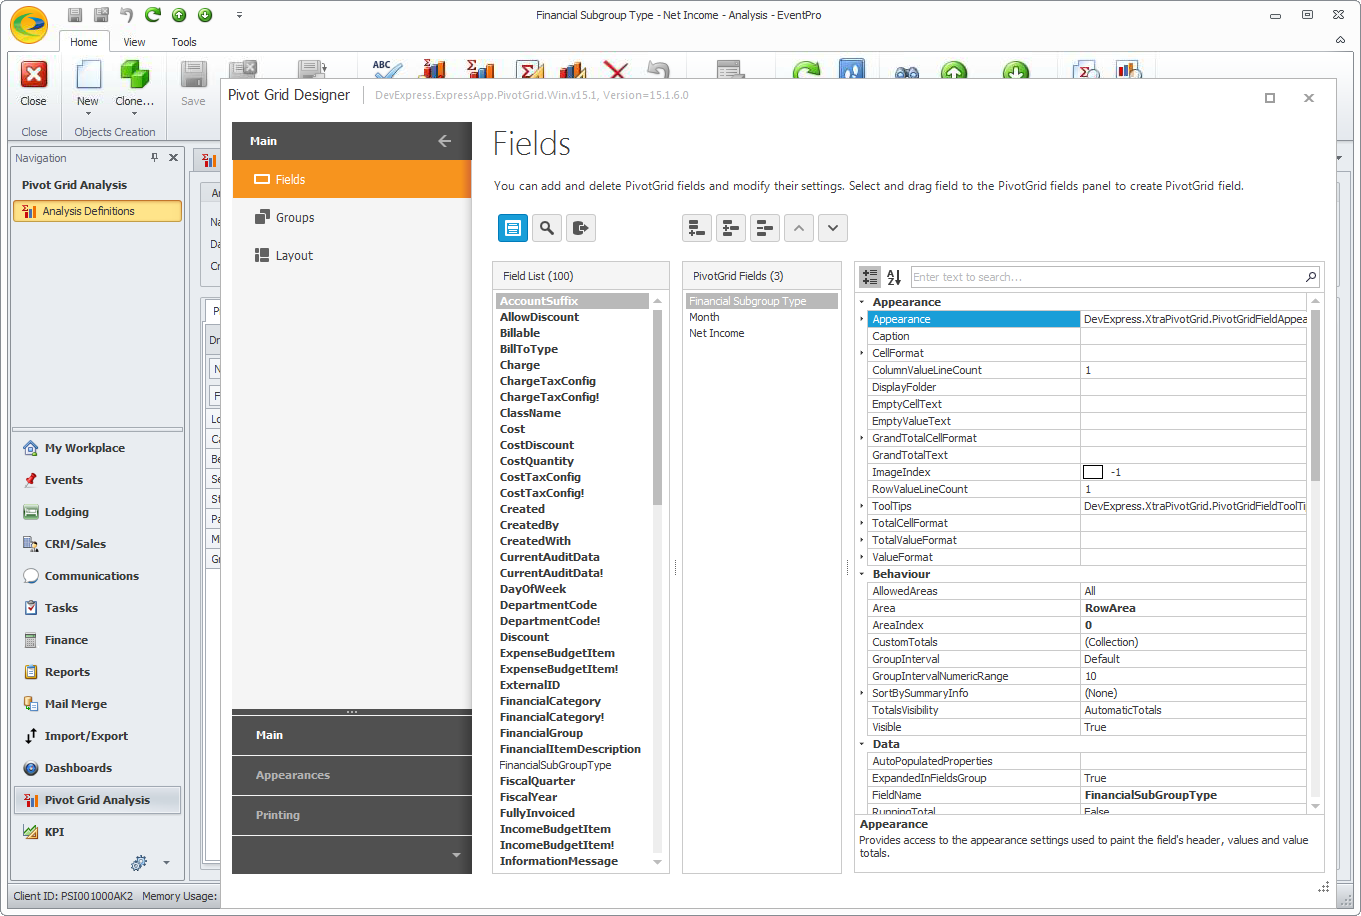
c.The area to the right displays the Properties of the selected field in the Pivot Grid Fields area.
In these Properties, you can adjust the appearance, behavior, and other options related to the field.
If you scroll down, you will see that there are numerous properties that can be edited, and even more if you click the toggle arrows to expand grouped fields.
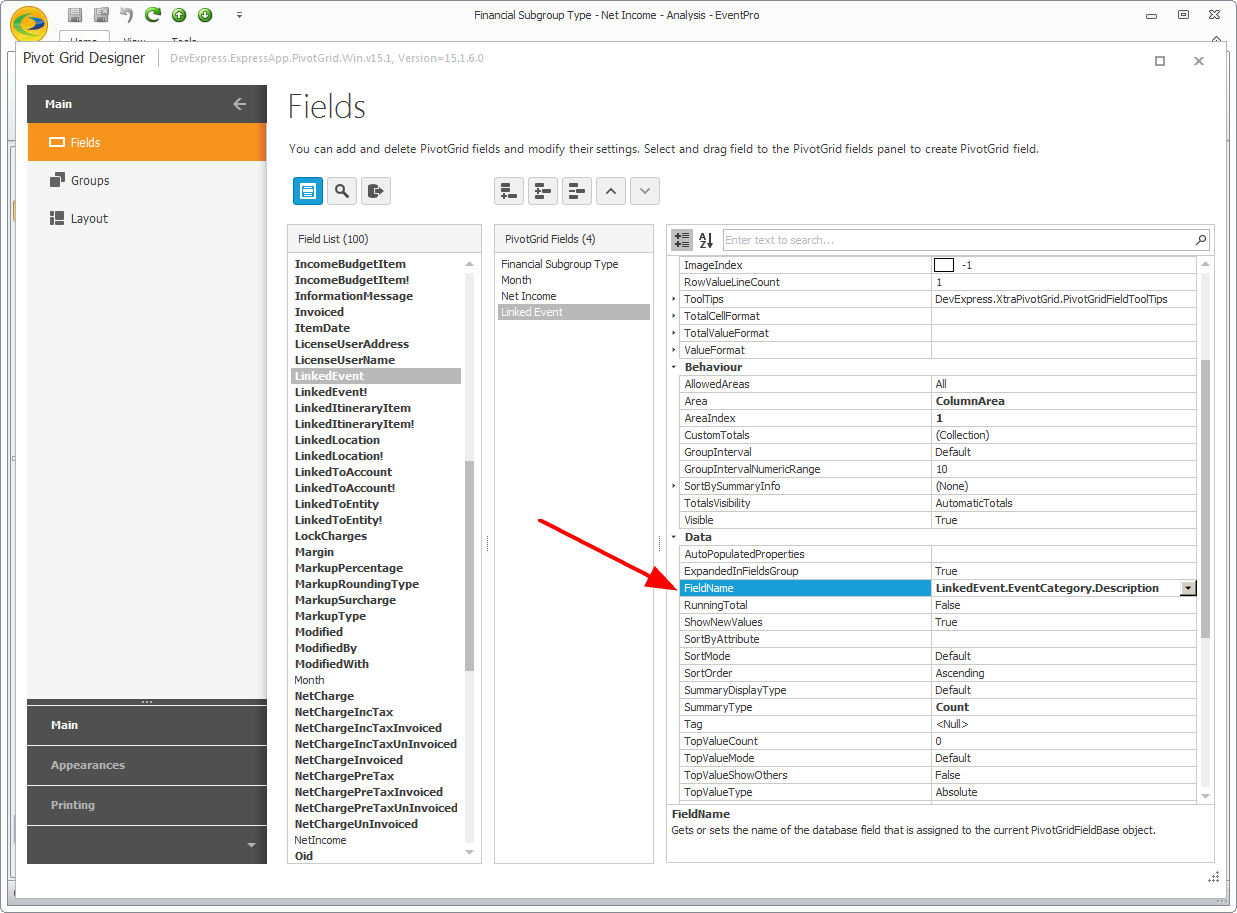
d.If you can't find a particular field in the Field List, it may be nested under a higher-level field. You can drill down into the higher-level field's properties to find the other field.
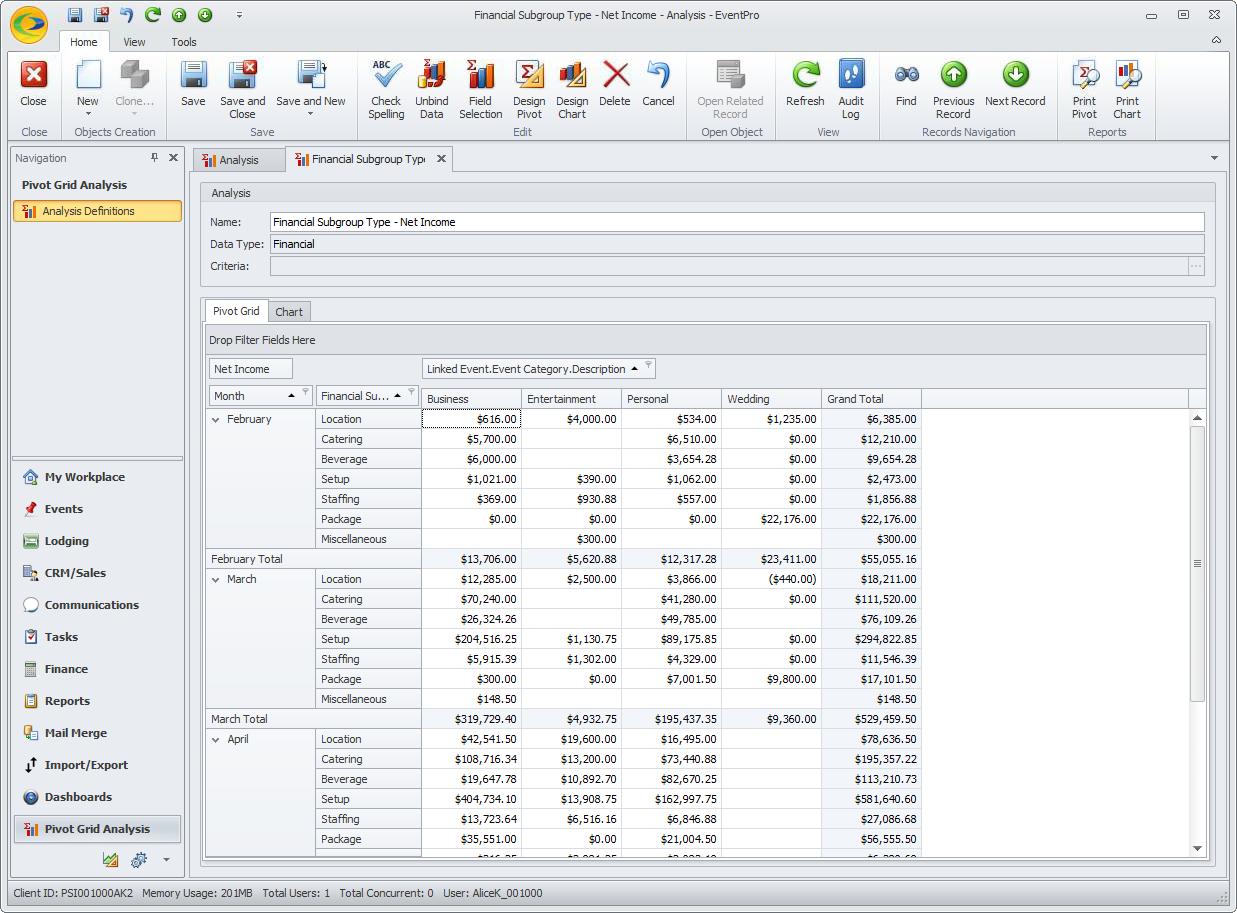
For example, let's say you want to analyze income by the Event Categories of the Linked Events.
Add the LinkedEvent field to the PivotGrid Fields column, and view its Properties.
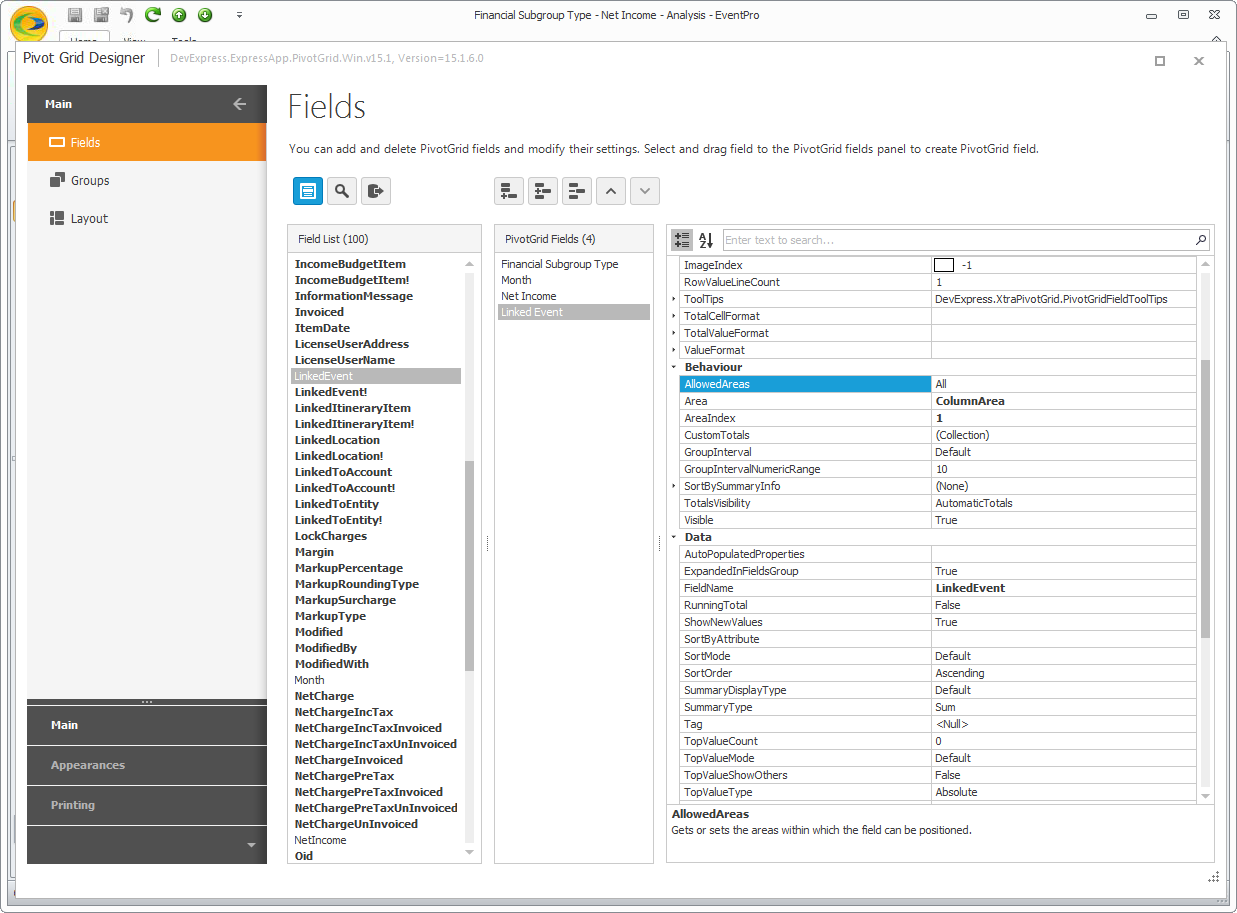
Under the Data heading, click the cell next to FieldName. A drop-down of nested fields will appear.
Use the plus (+) signs to expand the fields under Linked Event, and then Event Category (you will need to scroll down). Under Event Category, click on Description.
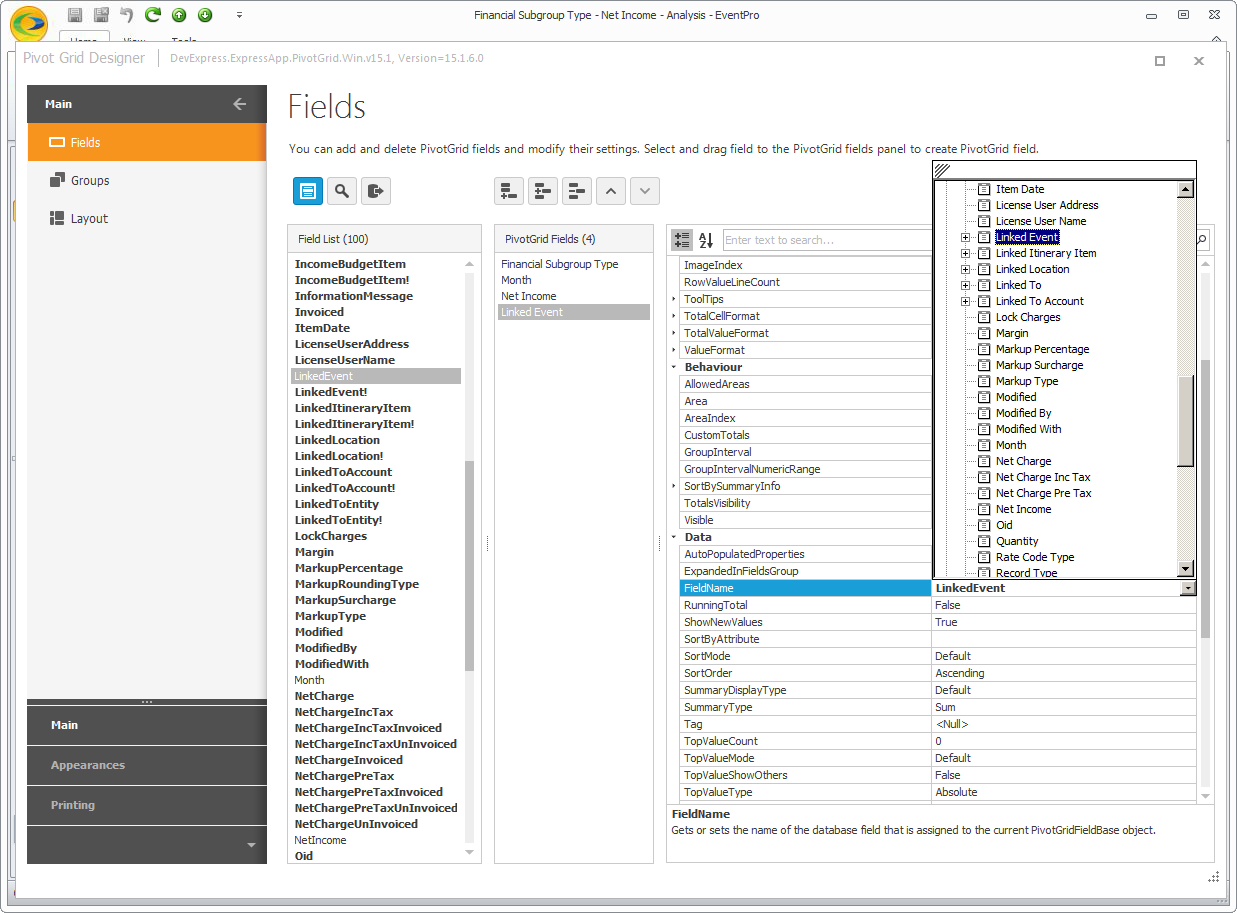
After a moment, the FieldName will change to LinkedEvent.EventCategory.Description. You will now be able to use the Event Category field in your Pivot Grid.
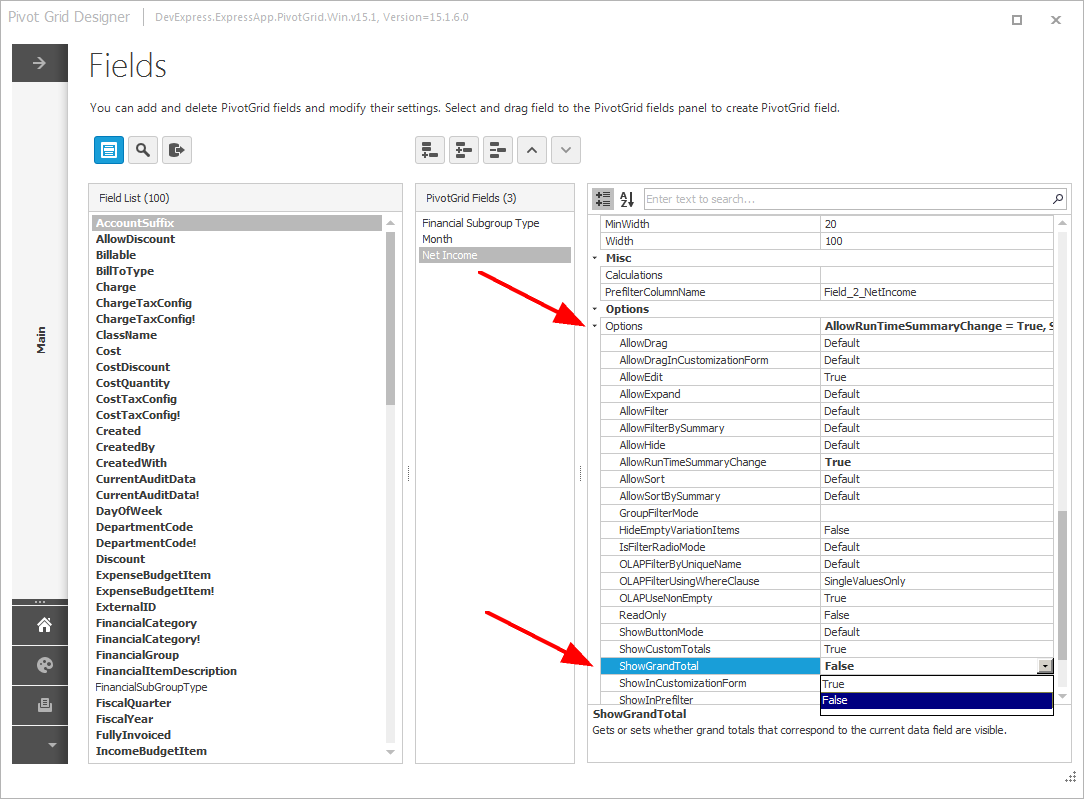
e.Another field property of particular interest is Grand Totals.
By default, the Pivot Grid will display all of the Grand Totals, which are calculated for all the displayed data.
If, however, you want to hide the Grand Totals that correspond to a particular data field, select the field in the middle column and scroll down through the Properties to find Options. Click the toggle arrow to expand the Options below the heading.
Find ShowGrandTotal, and use the drop-down to set it to False. The Grand Totals corresponding to this field will now be hidden in the Pivot Grid.
(Note that if you do not want to hide the Grand Totals here, there are other ways of hiding the Grand Totals in the Chart Wizard, described below.)
3.When you are done selecting fields, close the Pivot Grid Designer window.
You will notice that the fields have been added to the Pivot Grid, but probably not in the layout you intend for the final results, so it won't make much sense at the moment.
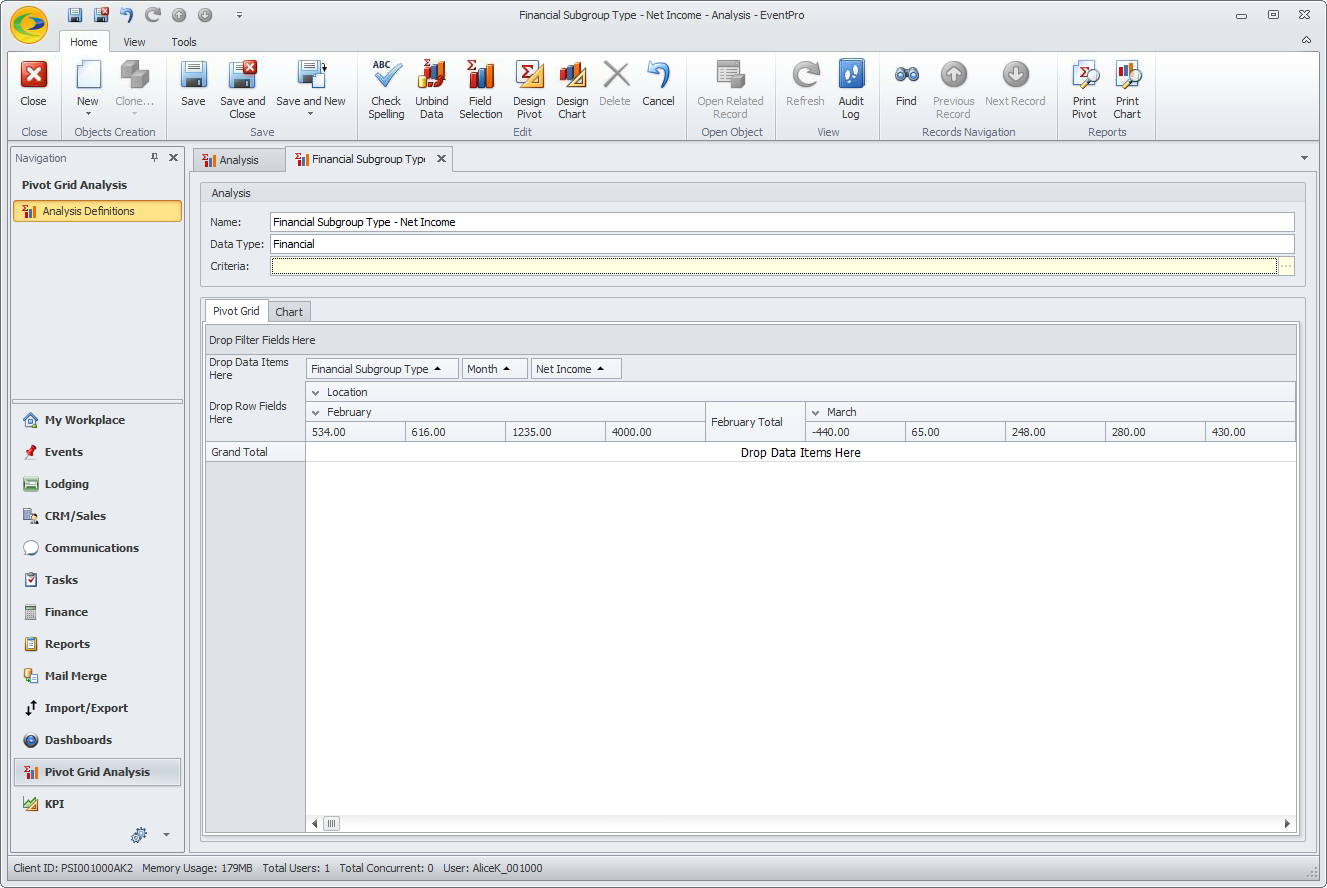
4.You can move the fields around to create the Layout you want. There are a few different ways of doing this.
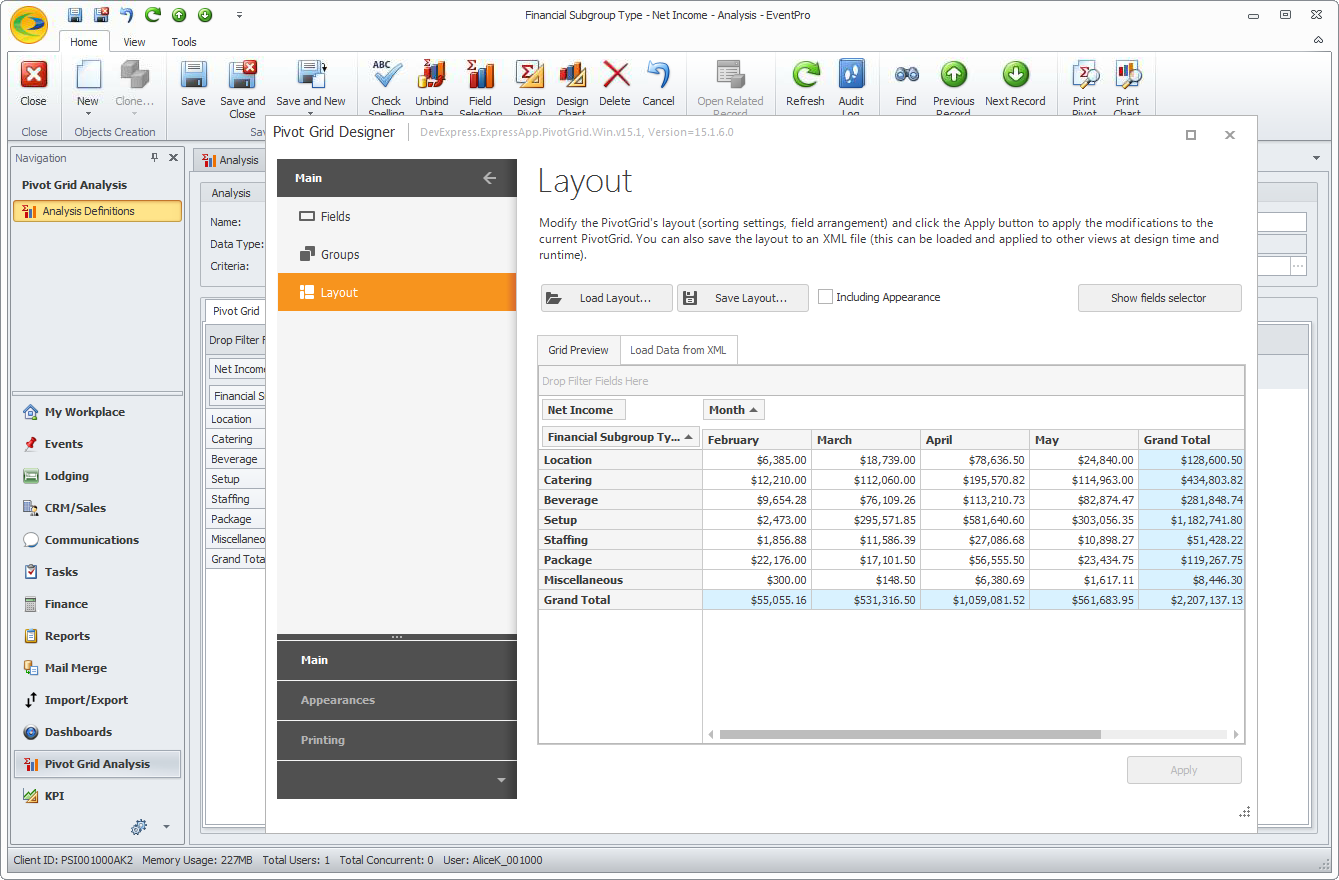
a.If you are still in the Pivot Grid Designer, and click the Layout option in the left-hand menu.
Drag-and-drop the fields in the Grid Preview. When you are done, click Apply, and close the window to view the Pivot Grid.
b.You can drag and drop the fields right in the Pivot Grid.
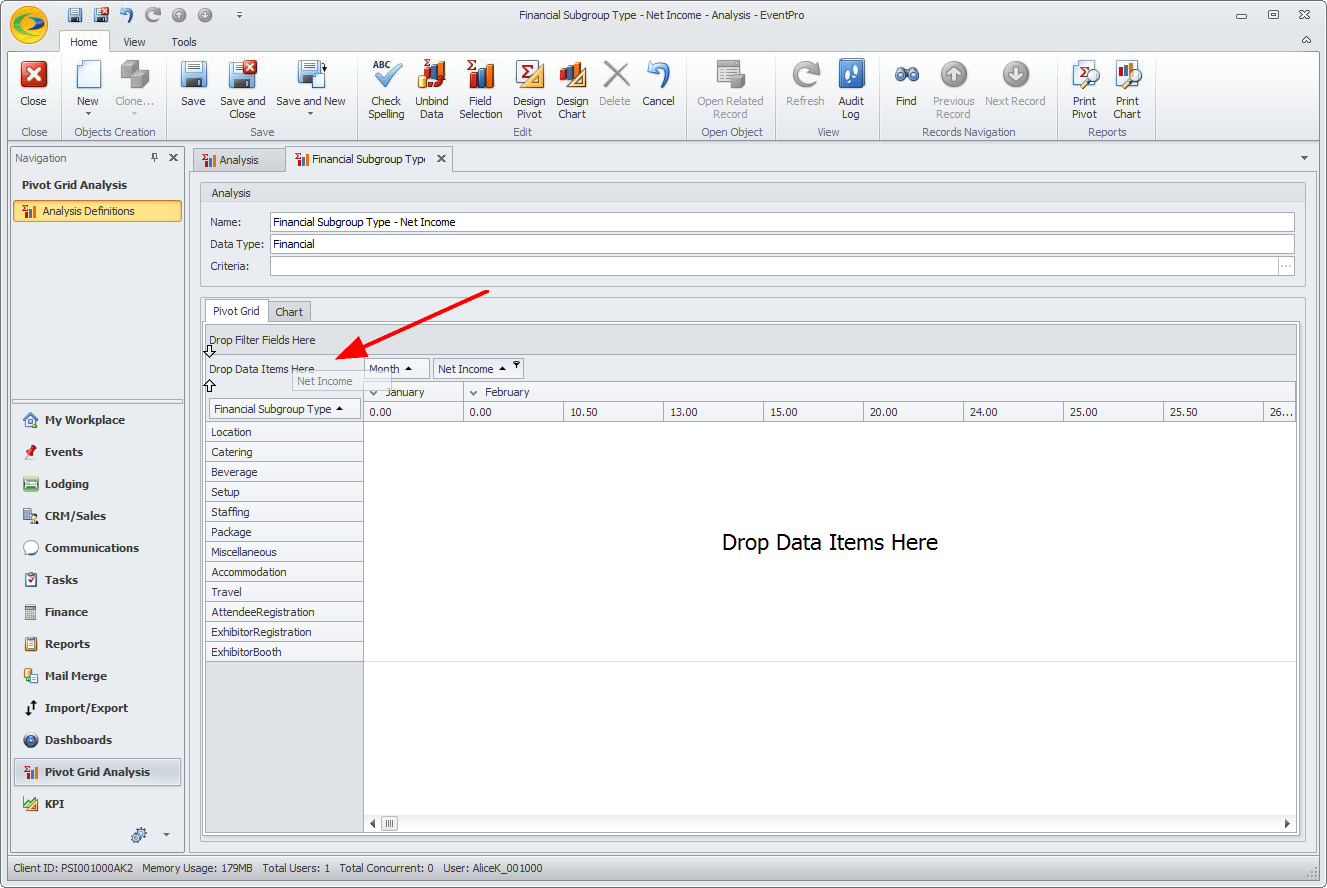
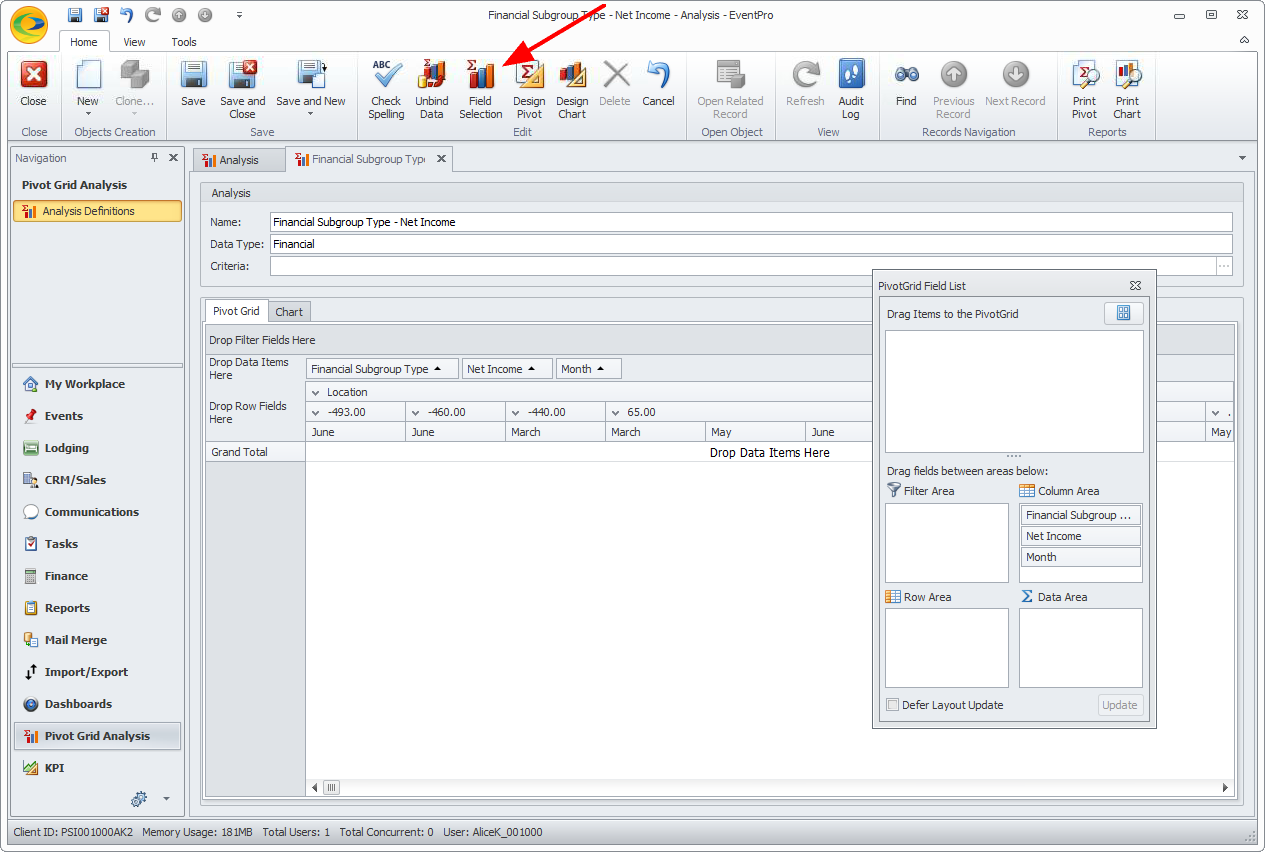
c.You can click the Field Selection button to open the Pivot Grid Field List window, and use it to organize the fields in the layout you prefer.
In the PivotGrid Field List window, you can drag and drop the fields among the different areas, e.g. Row, Column and Data, and the Pivot Grid will adjust accordingly.
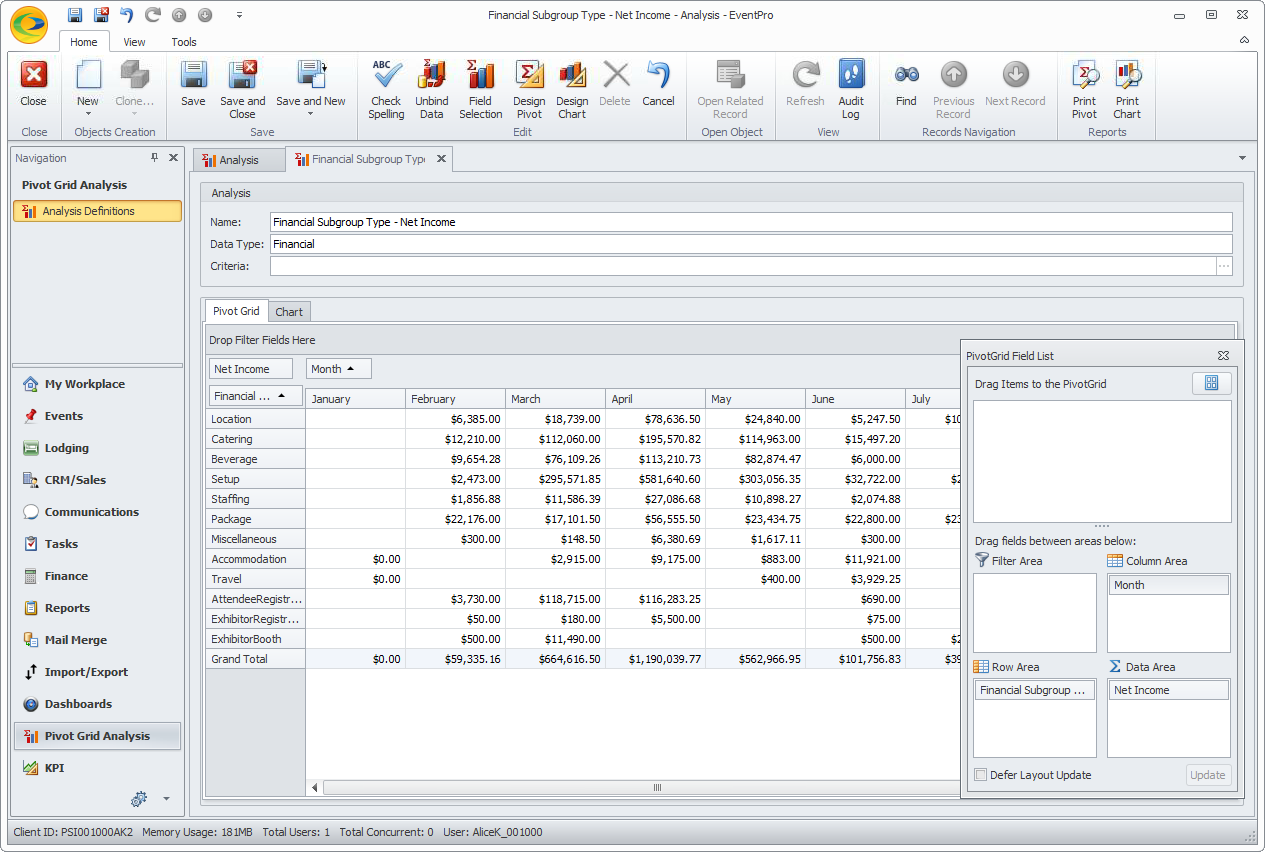
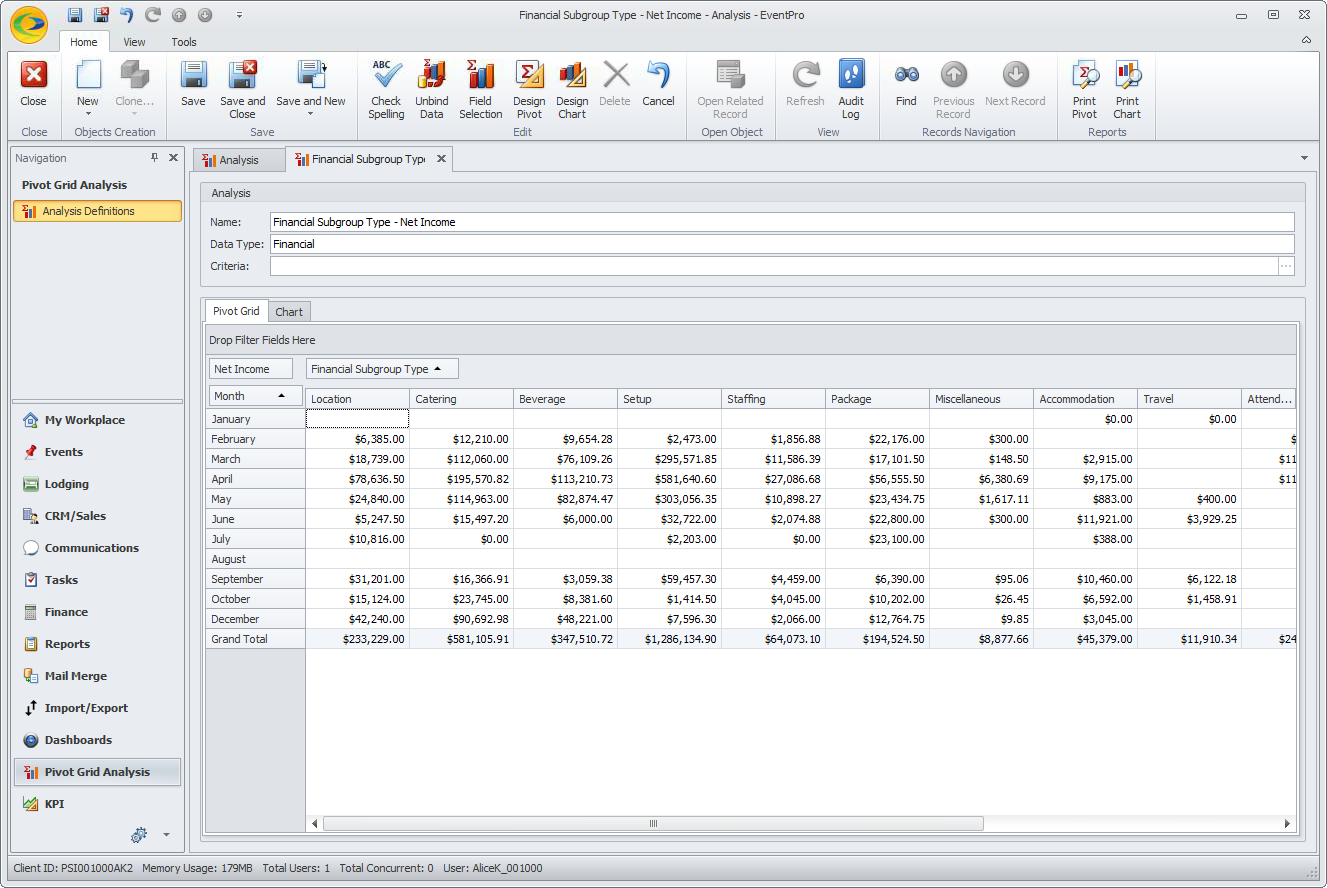
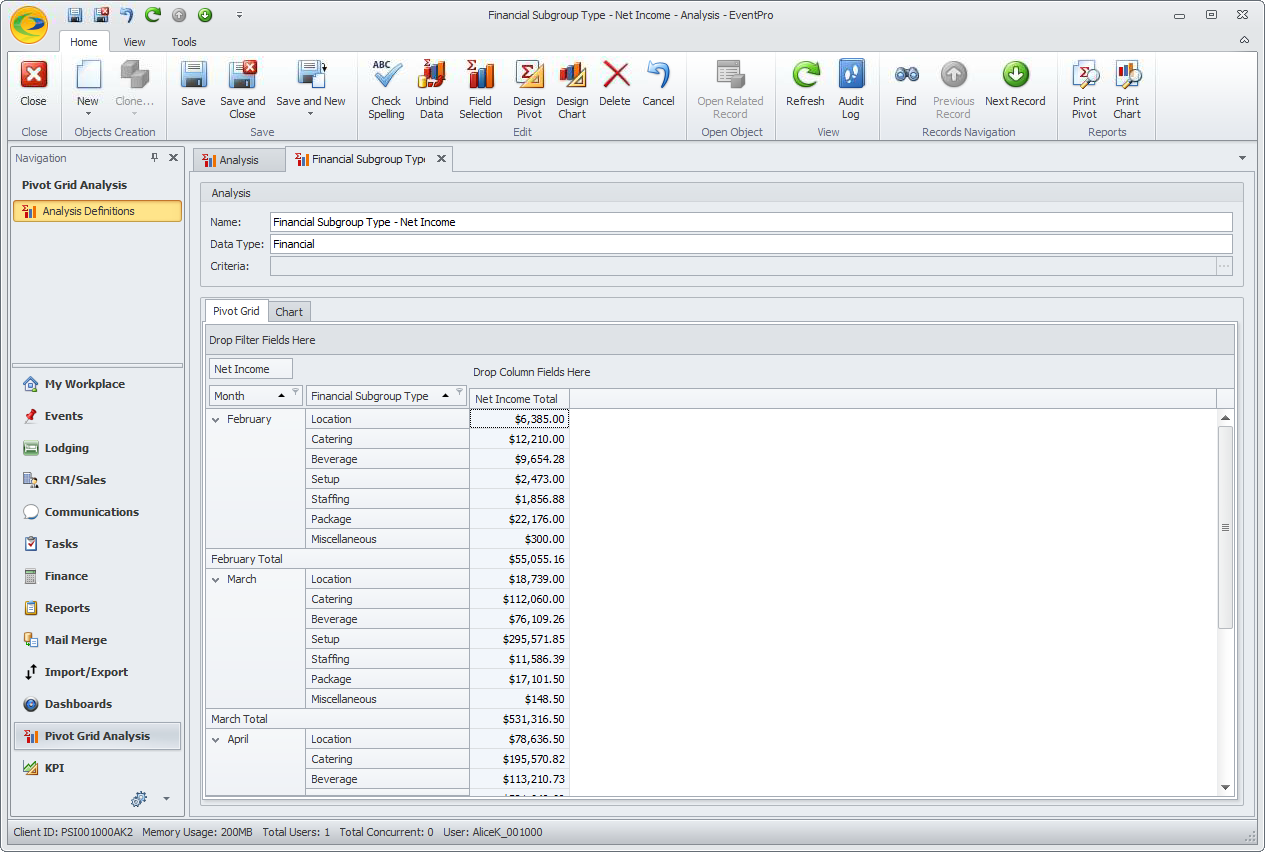
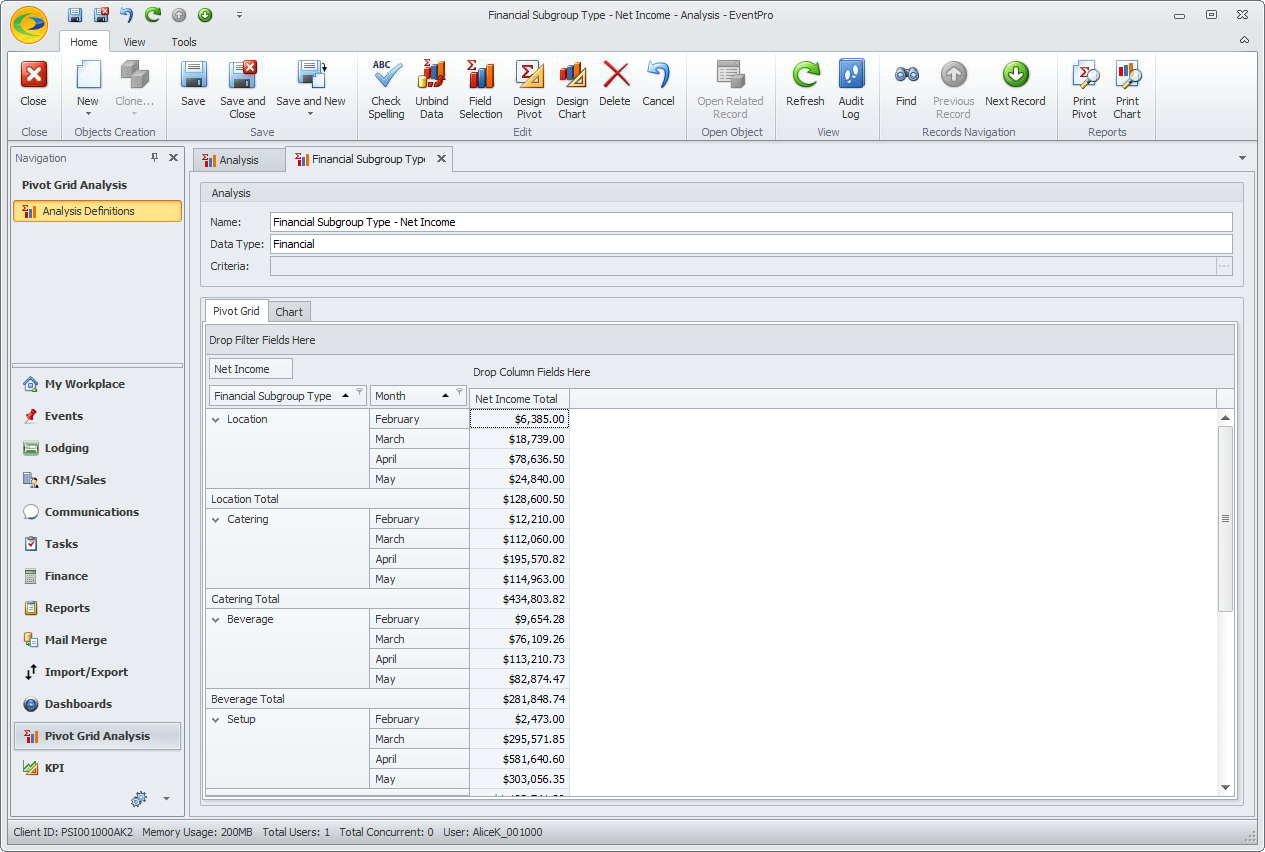
5.By moving fields between the Column, Row and Data Item areas, you can experiment with different ways of viewing the data.
Click the heading below to see other layouts for our Pivot Grid example.

6.Once you find the layout you prefer, it's a good idea to Save your Pivot Grid now, to ensure that you don't lose the work you have done so far.
7.If you want to further organize and streamline your Pivot Grid, to go Sort & Filter.