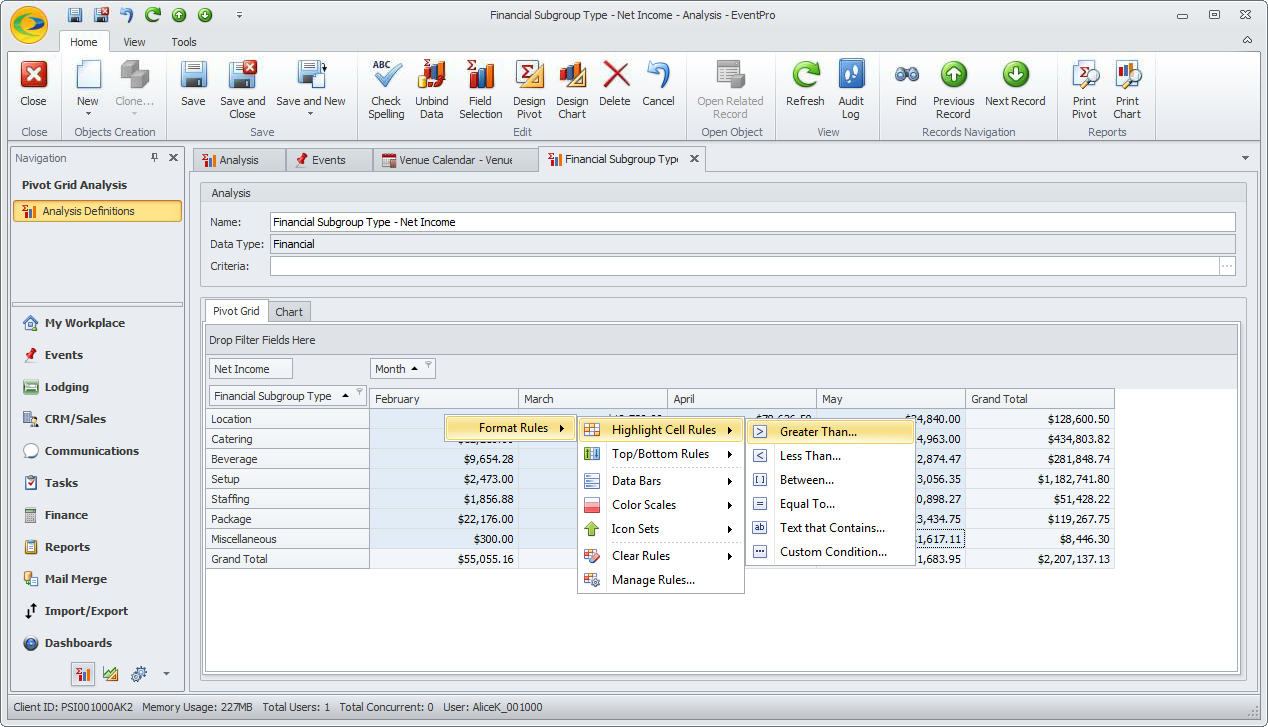
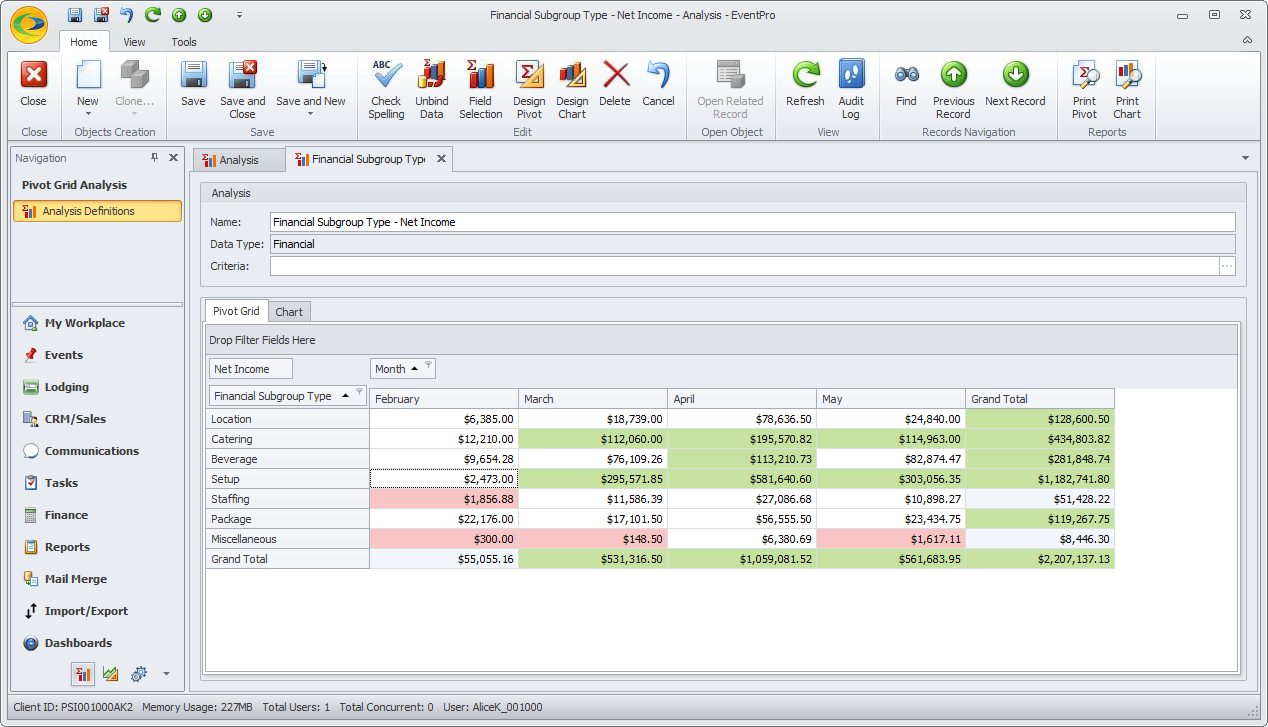
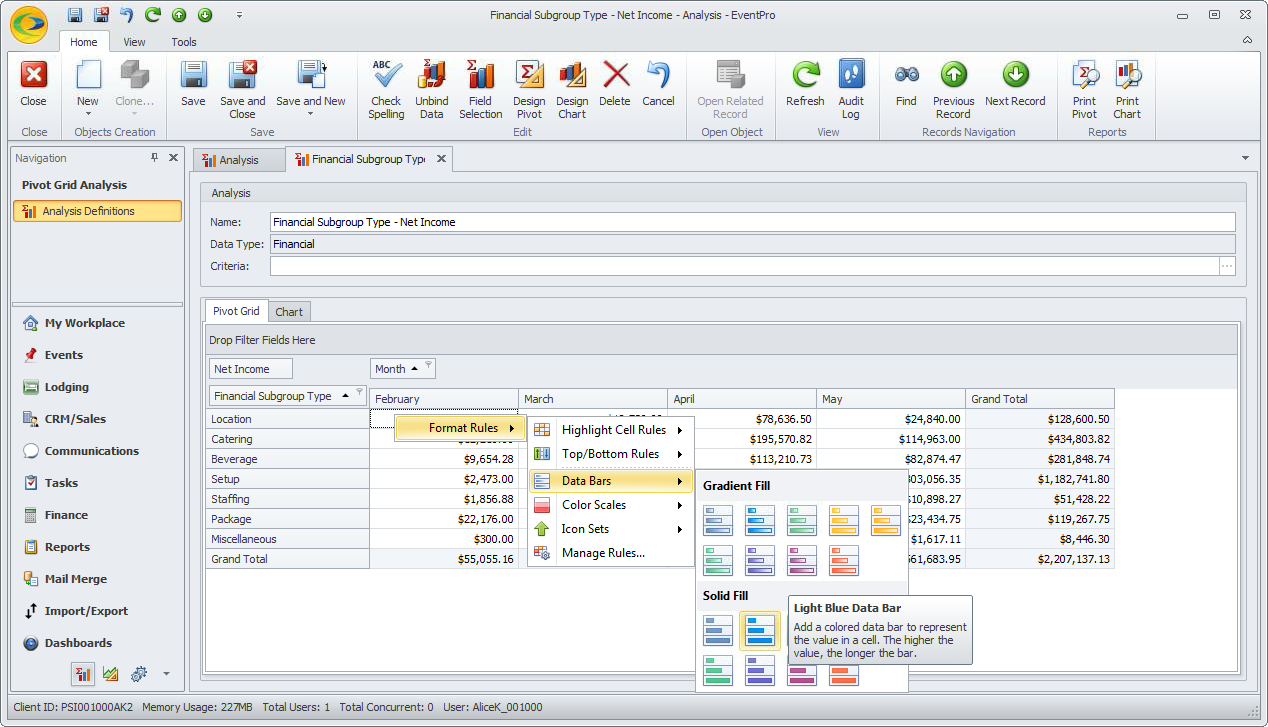
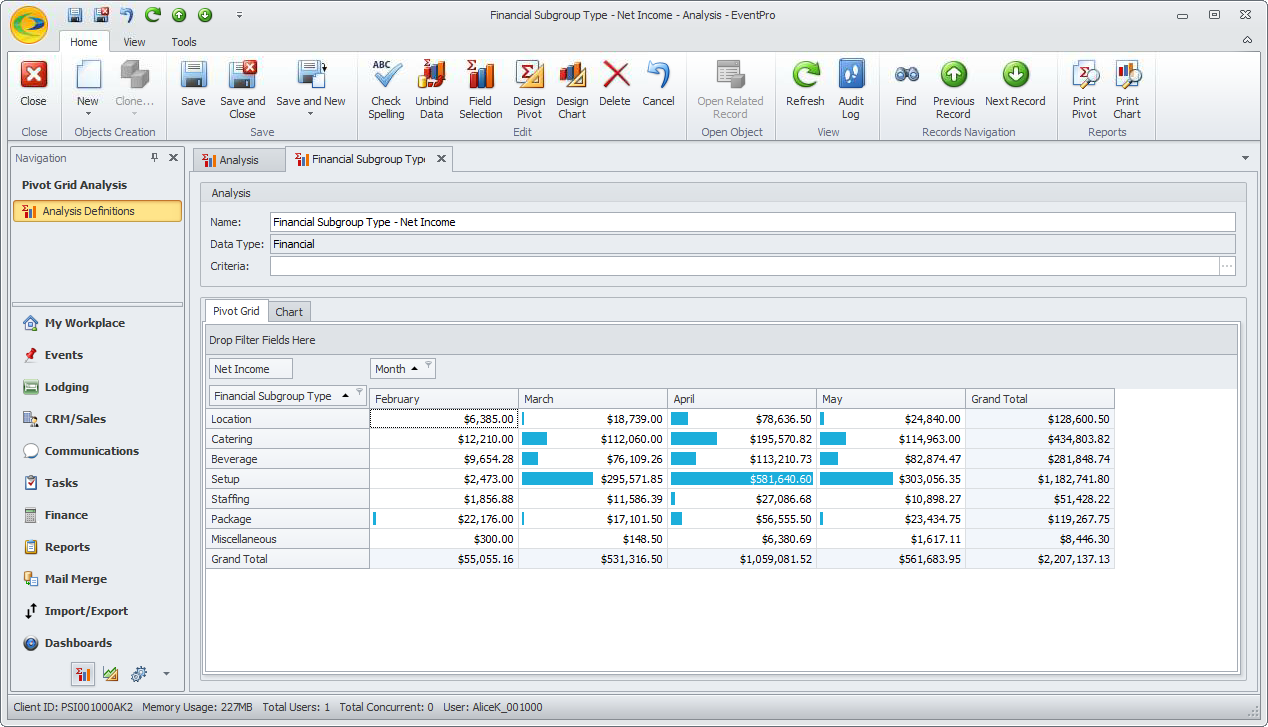
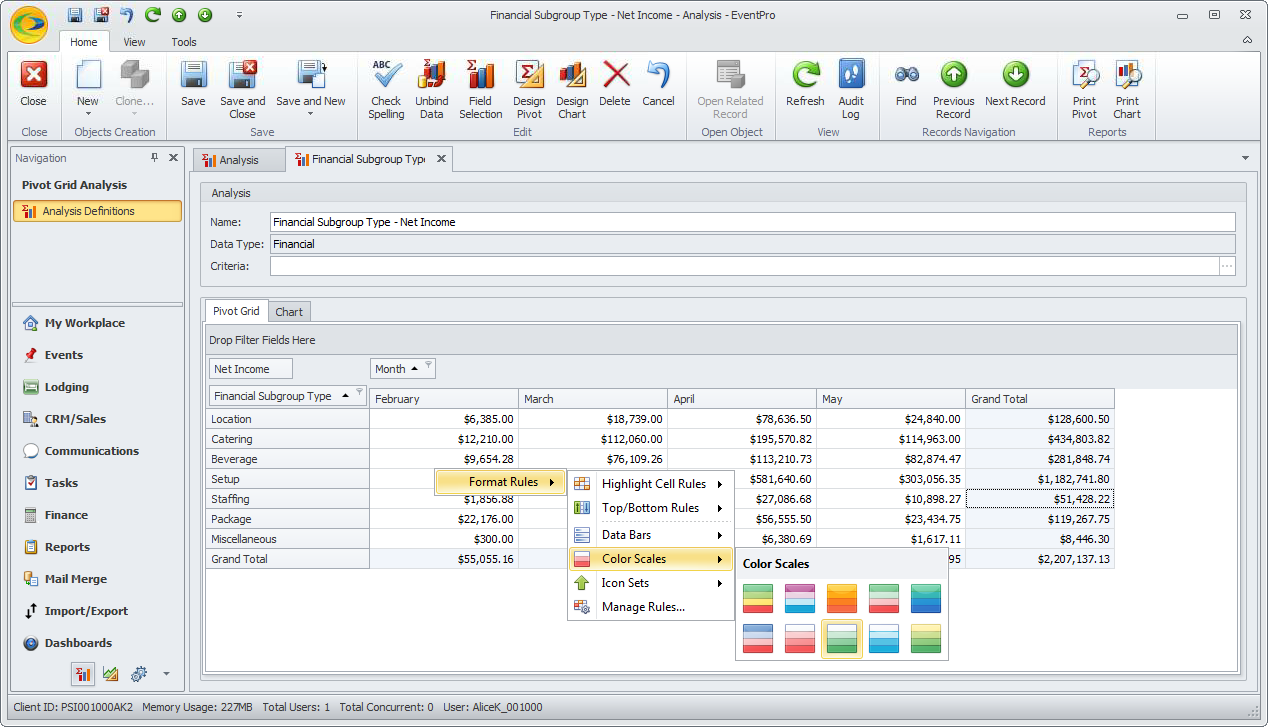
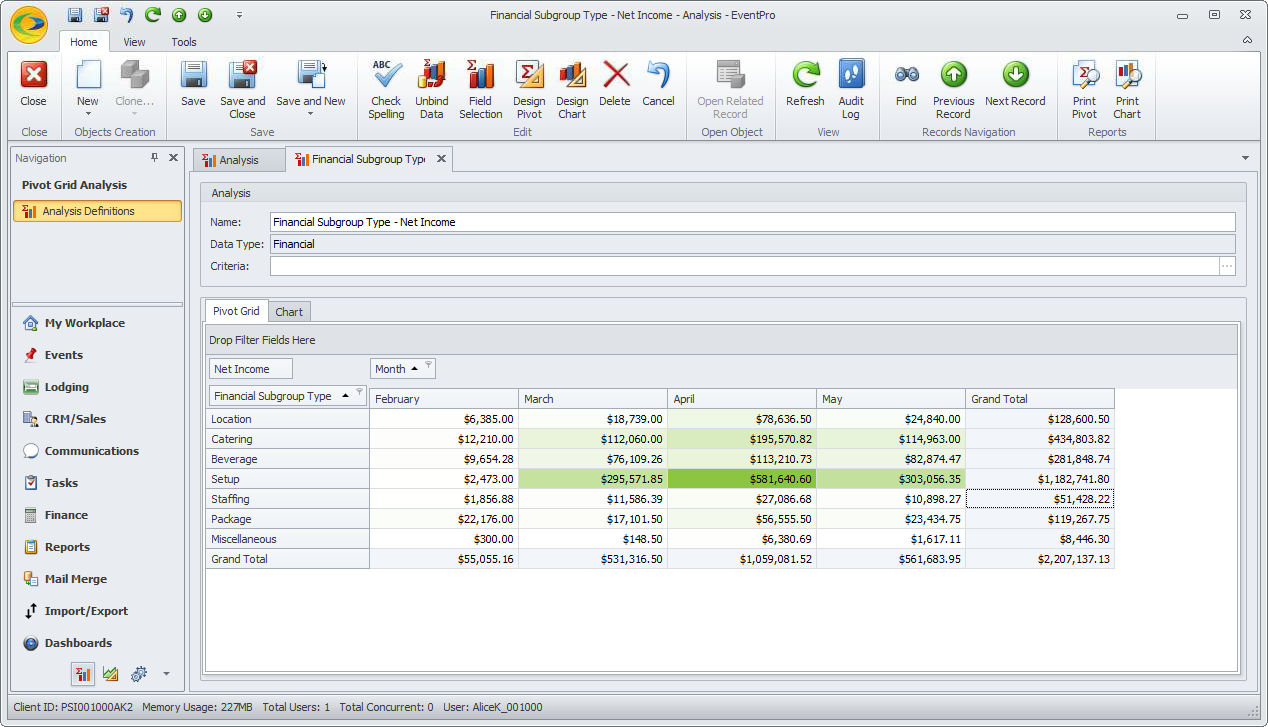
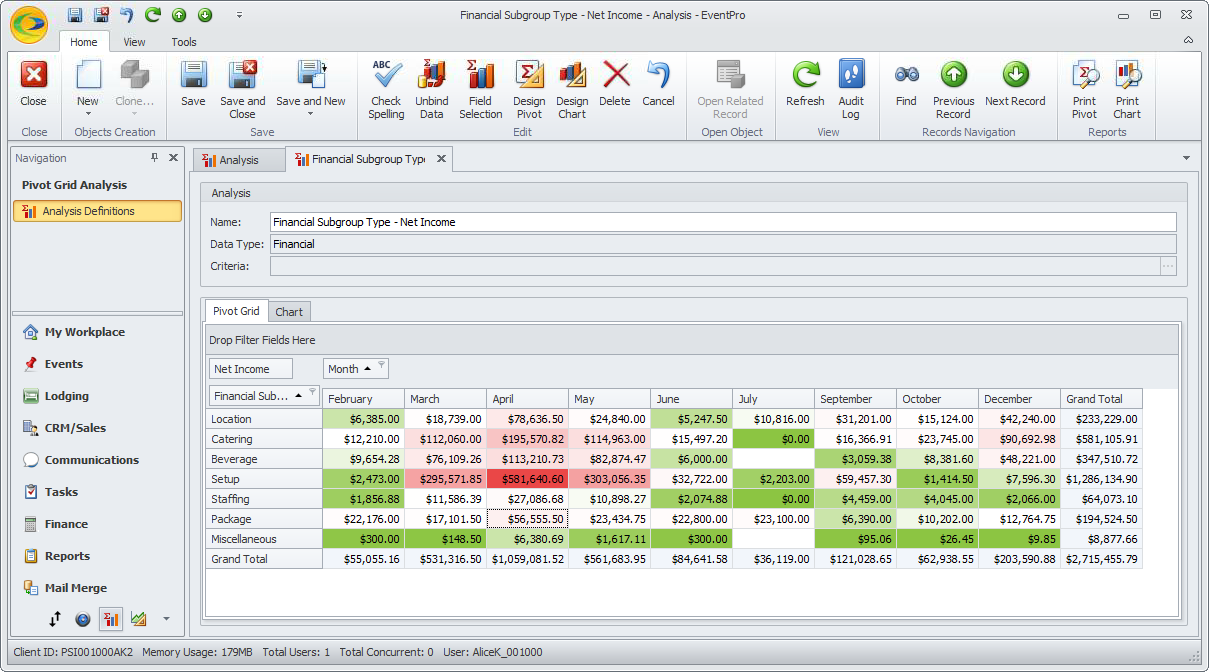
Format Rules allow you to apply conditional formatting to the Pivot Grid, meaning that the individual cells will take on formatting you have defined (e.g. certain fonts, colors, other visual characteristics) when the data within meets the conditions you set. These visual enhancements can help you to more easily identify trends and exceptions in the data.
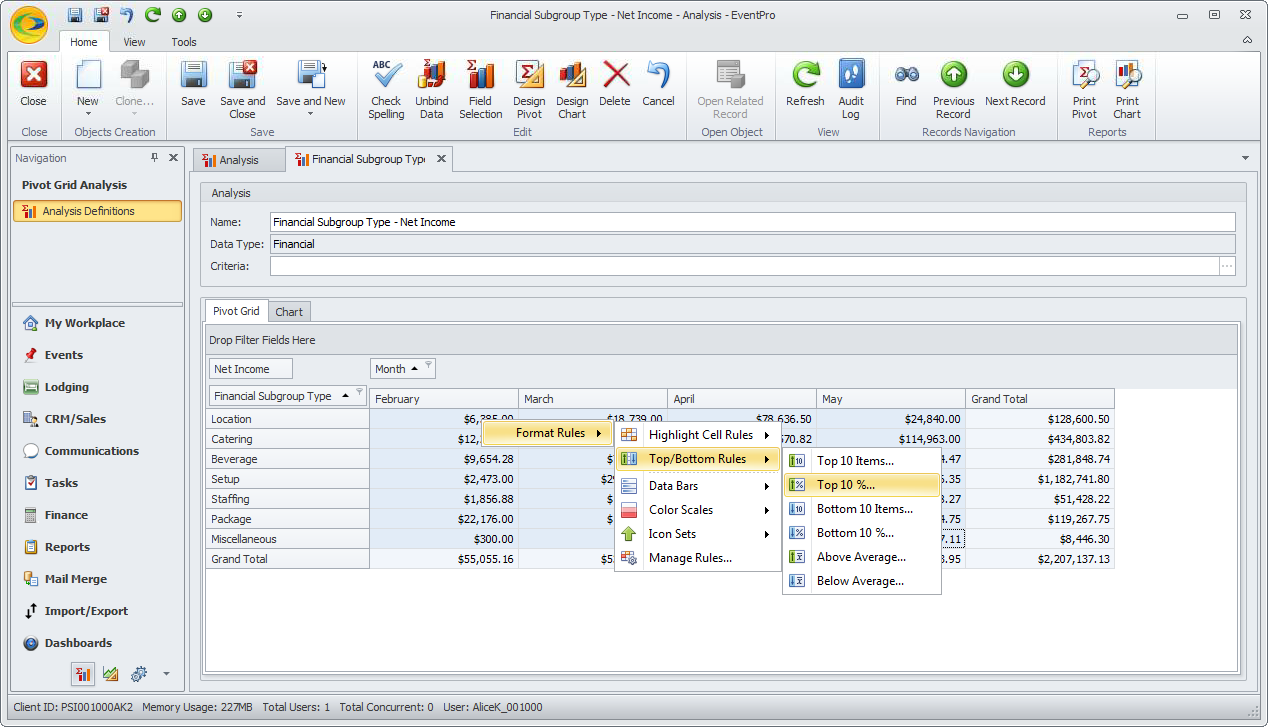
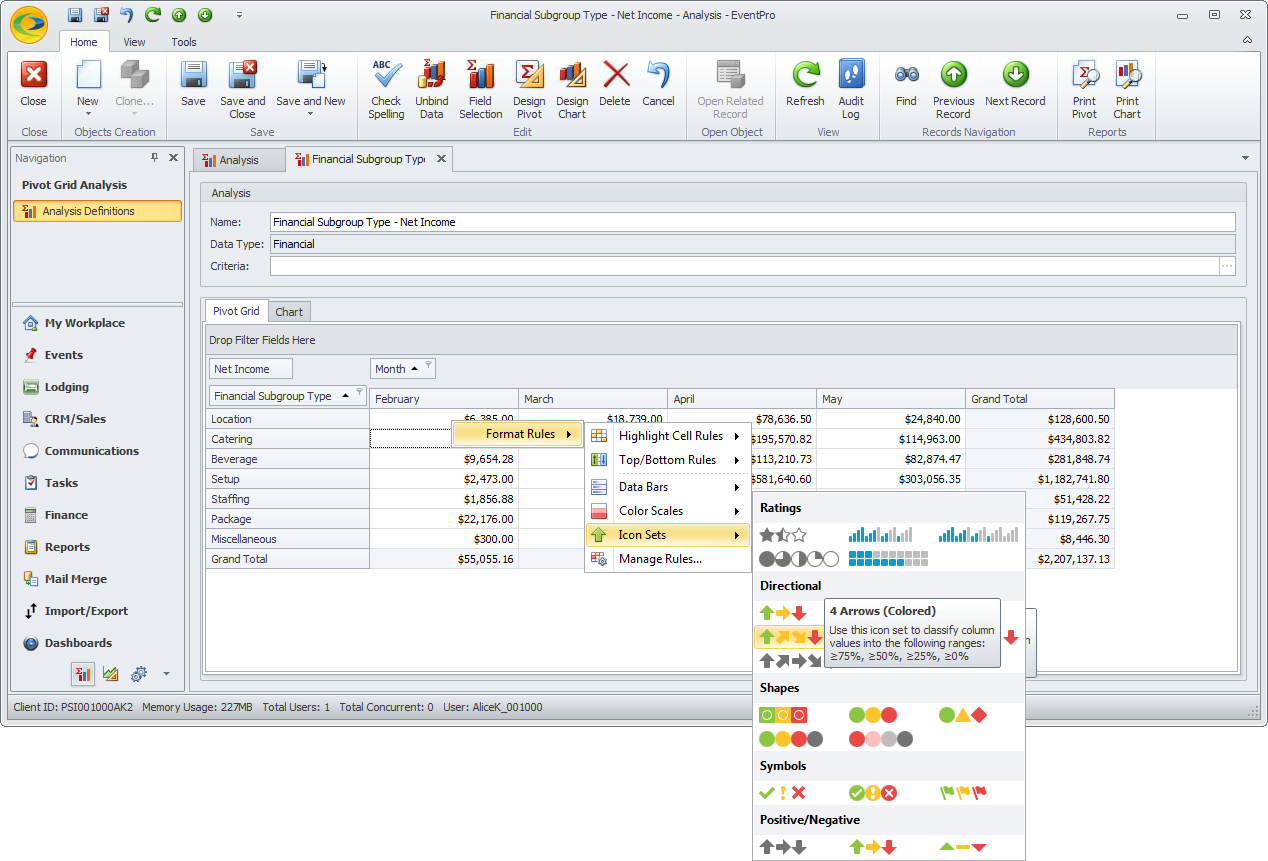
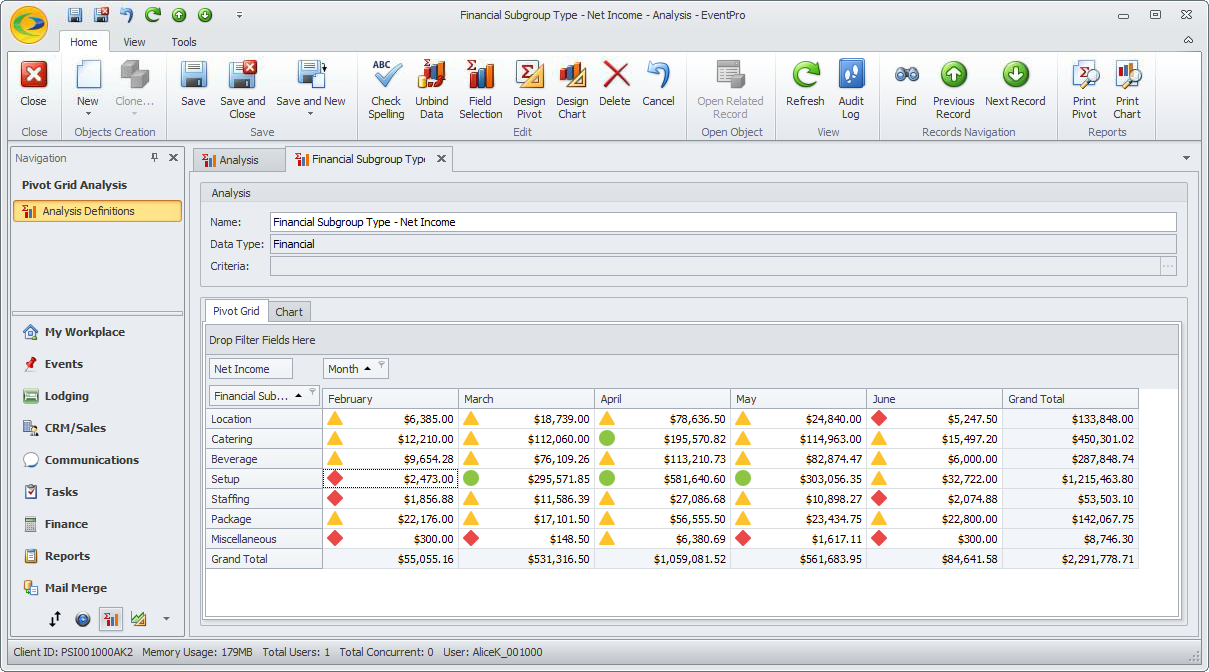
As with the other functions of the Pivot Grid, there are so many options and variations that it would be almost impossible to describe them all. In the examples below, we will demonstrate some common examples, which you can expand on and customize for your own purposes:

If you aren't happy with the appearance of your conditional formatting, and would like to erase it, you can clear the rules you have defined:
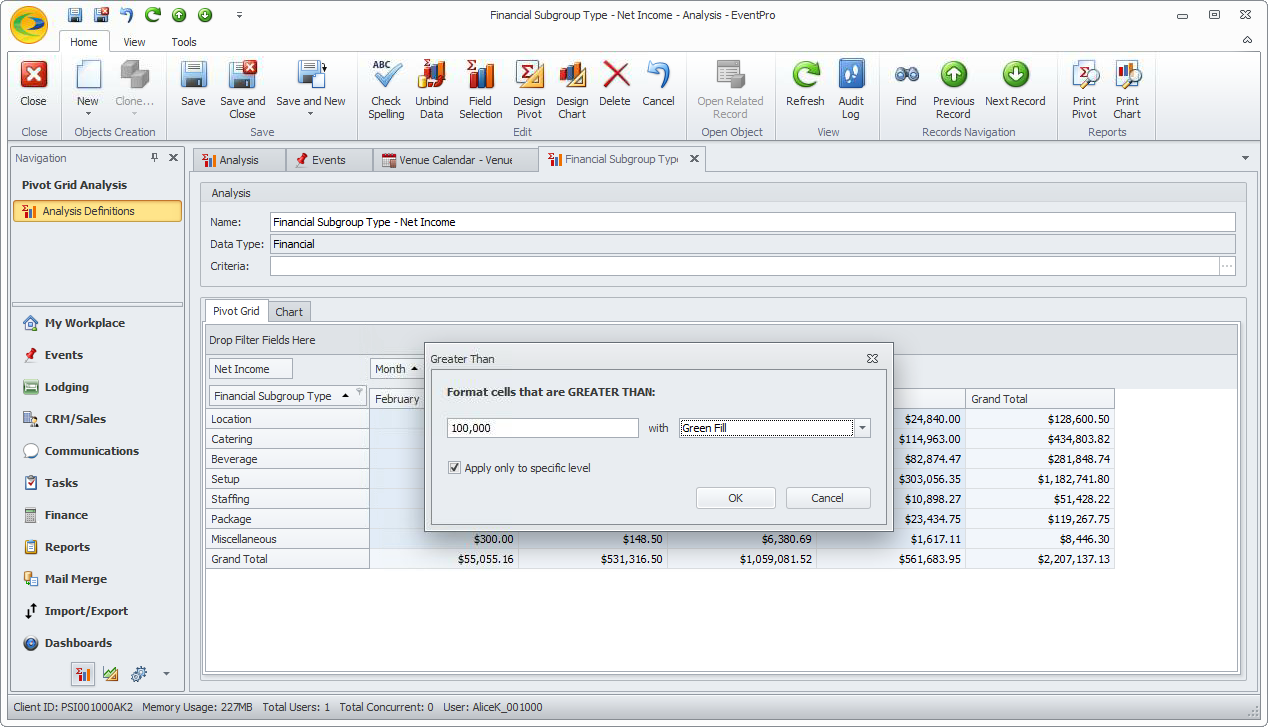
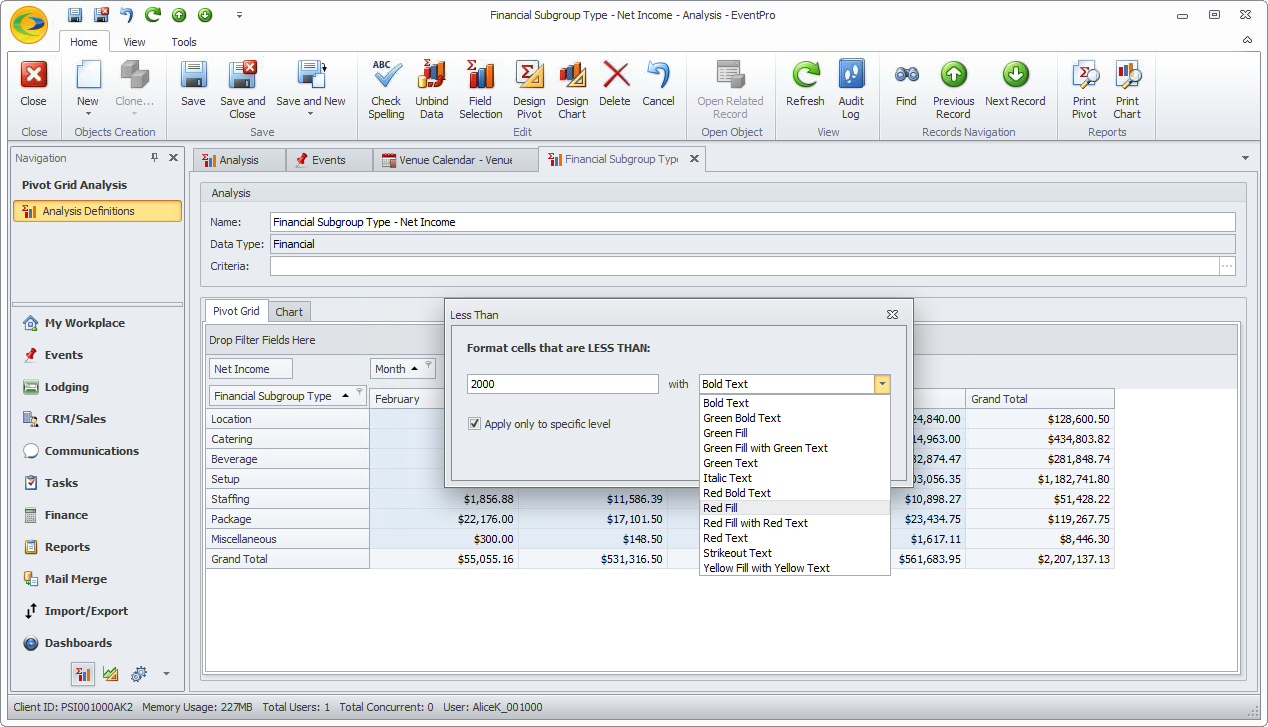
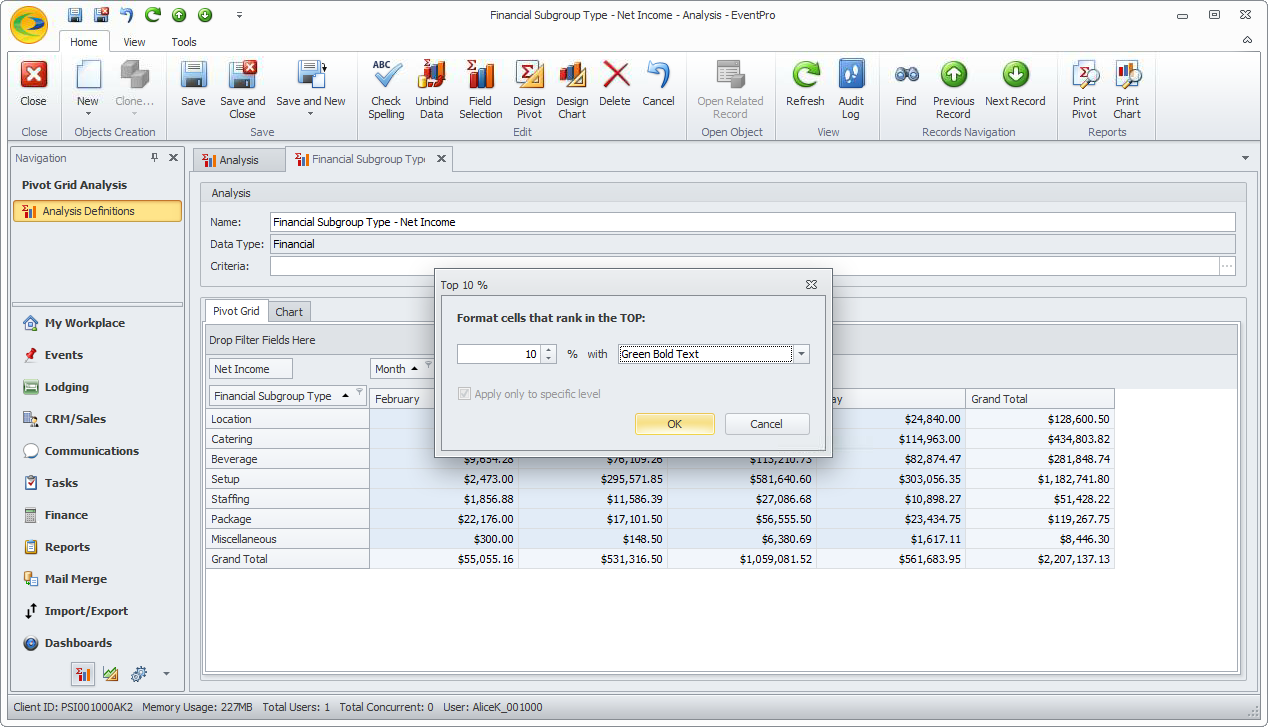
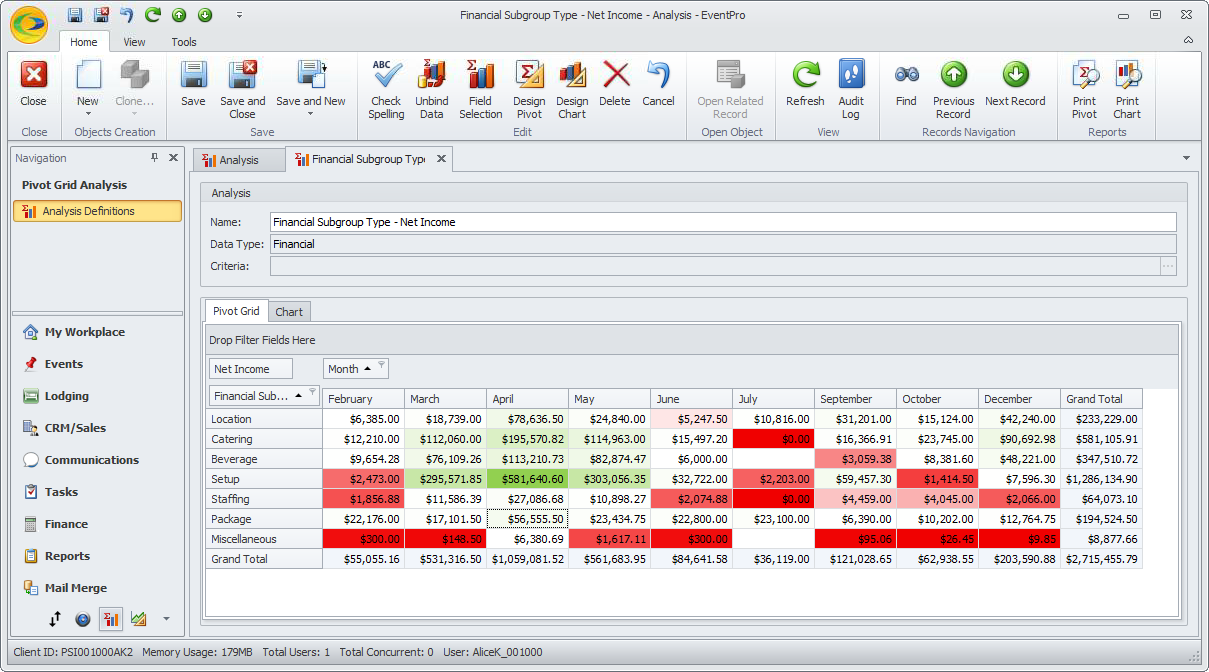
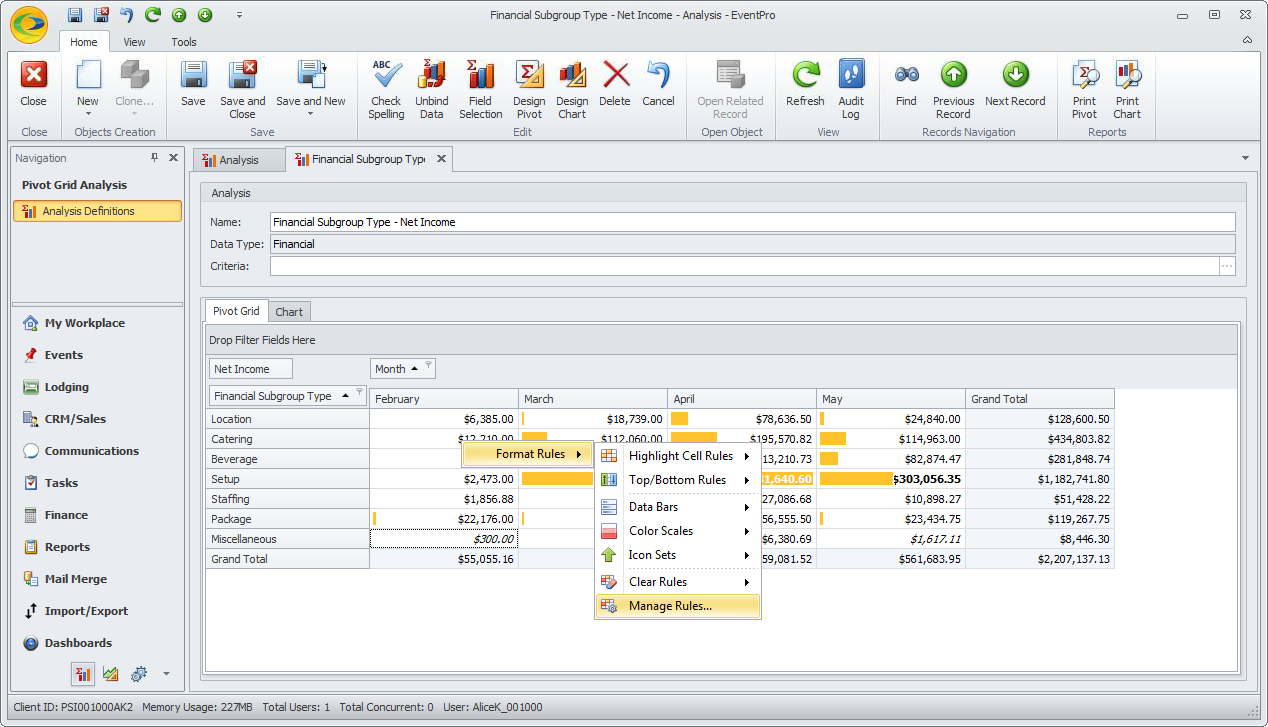
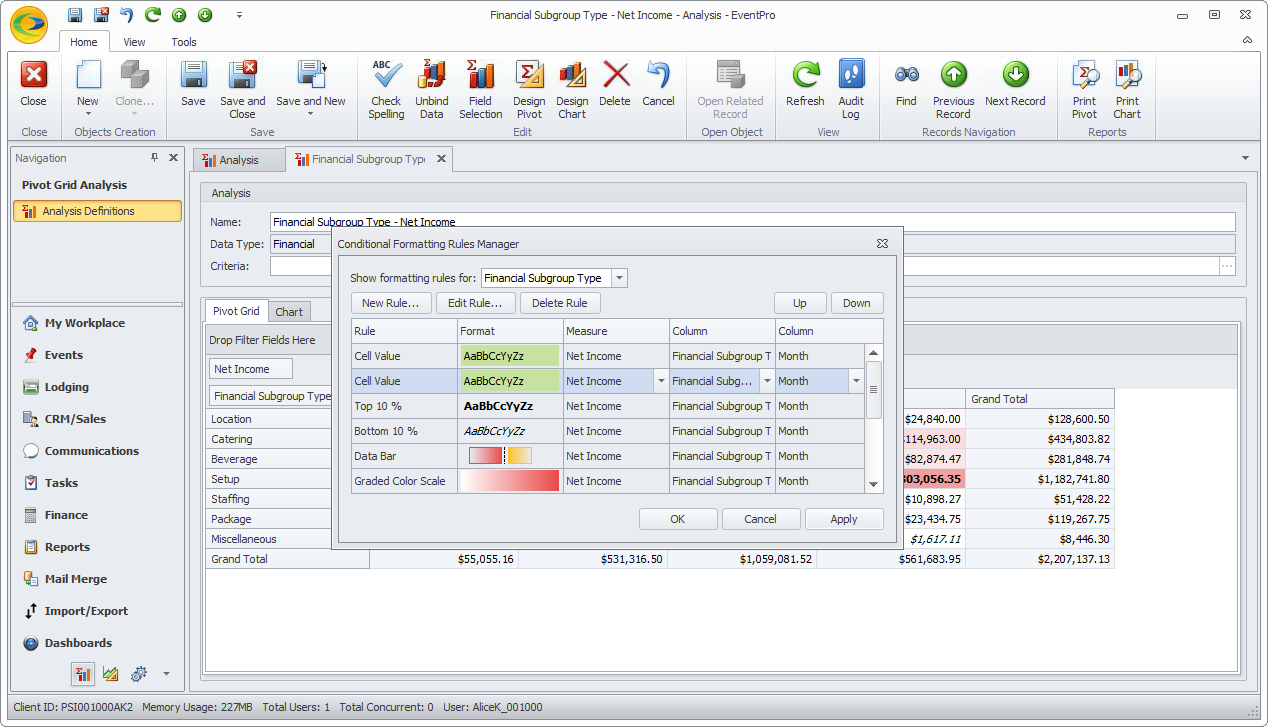
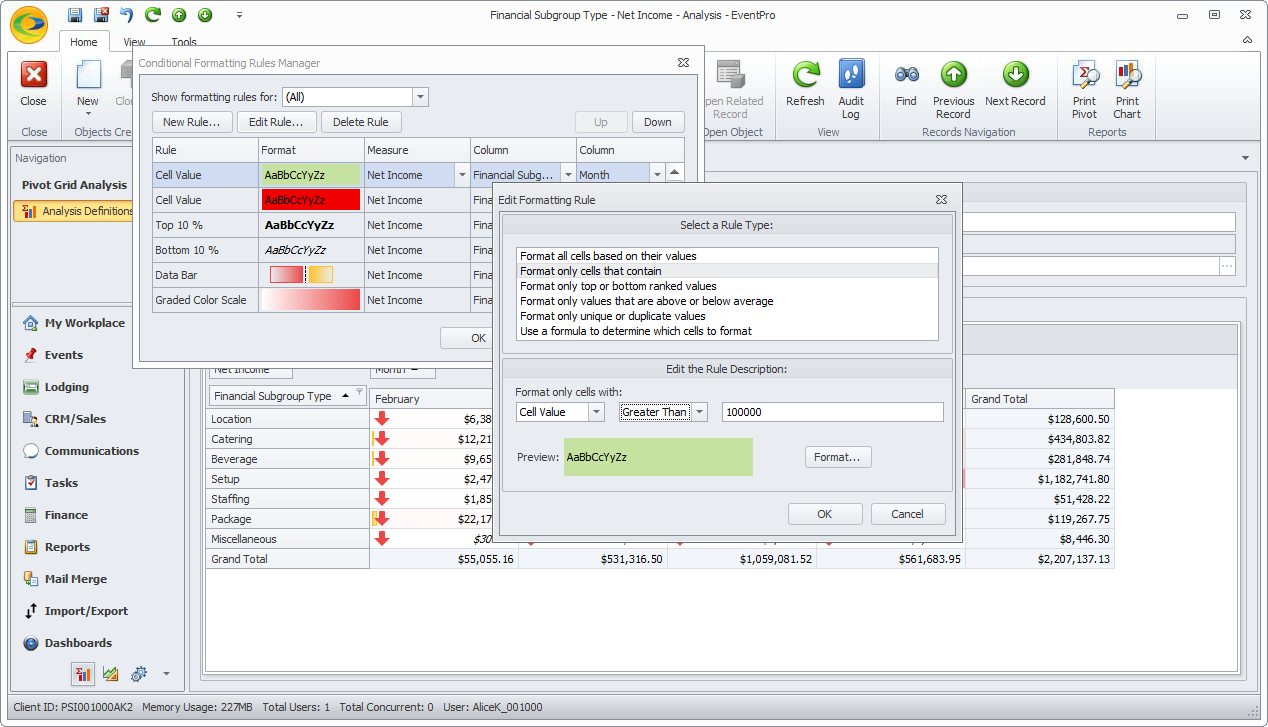
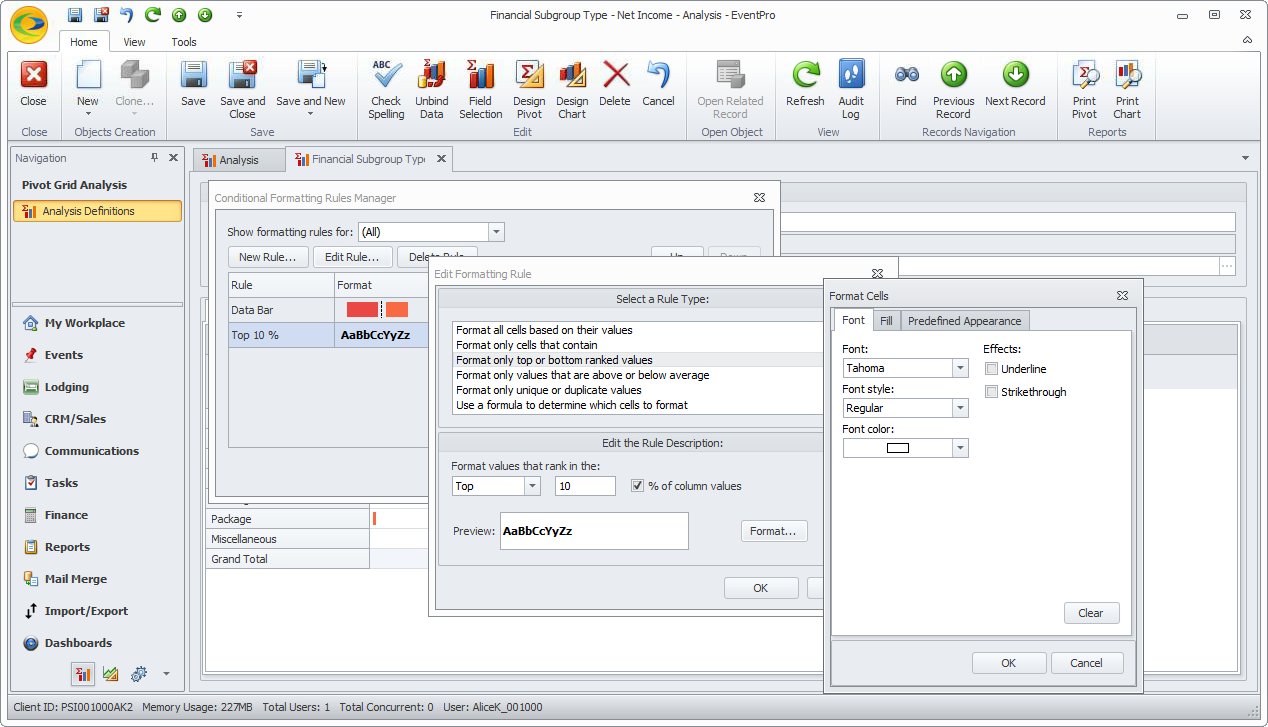
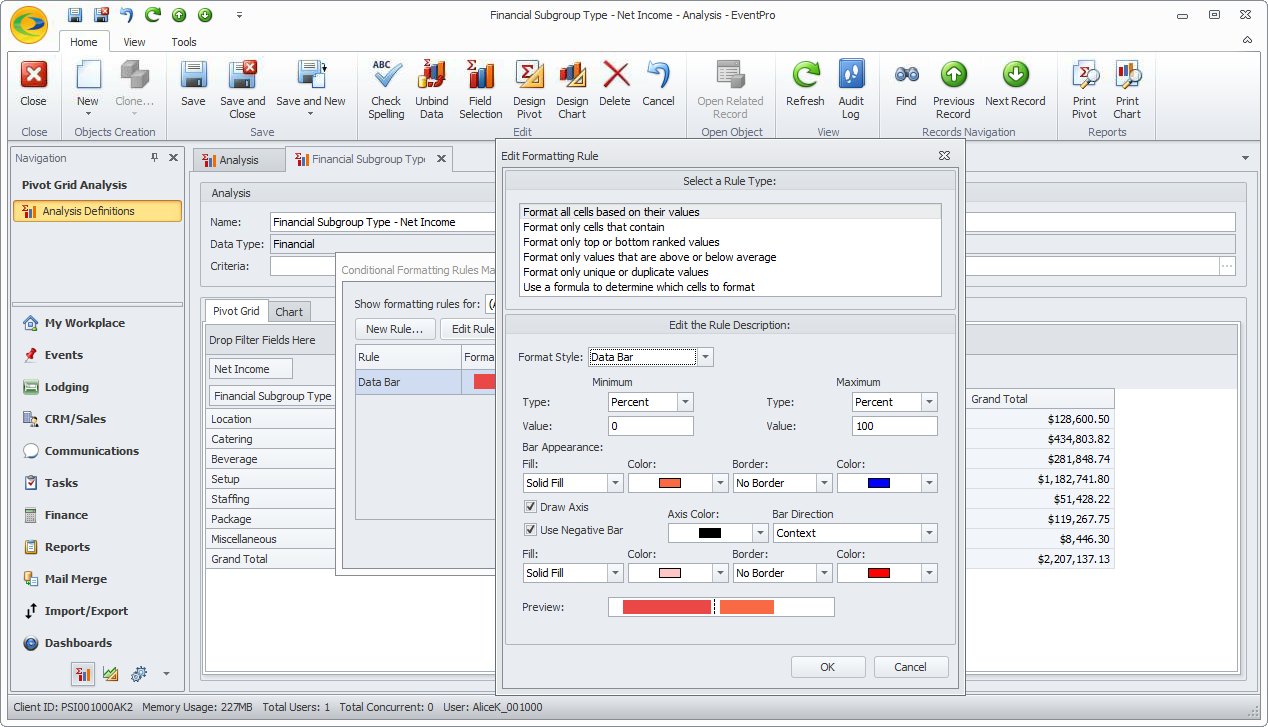
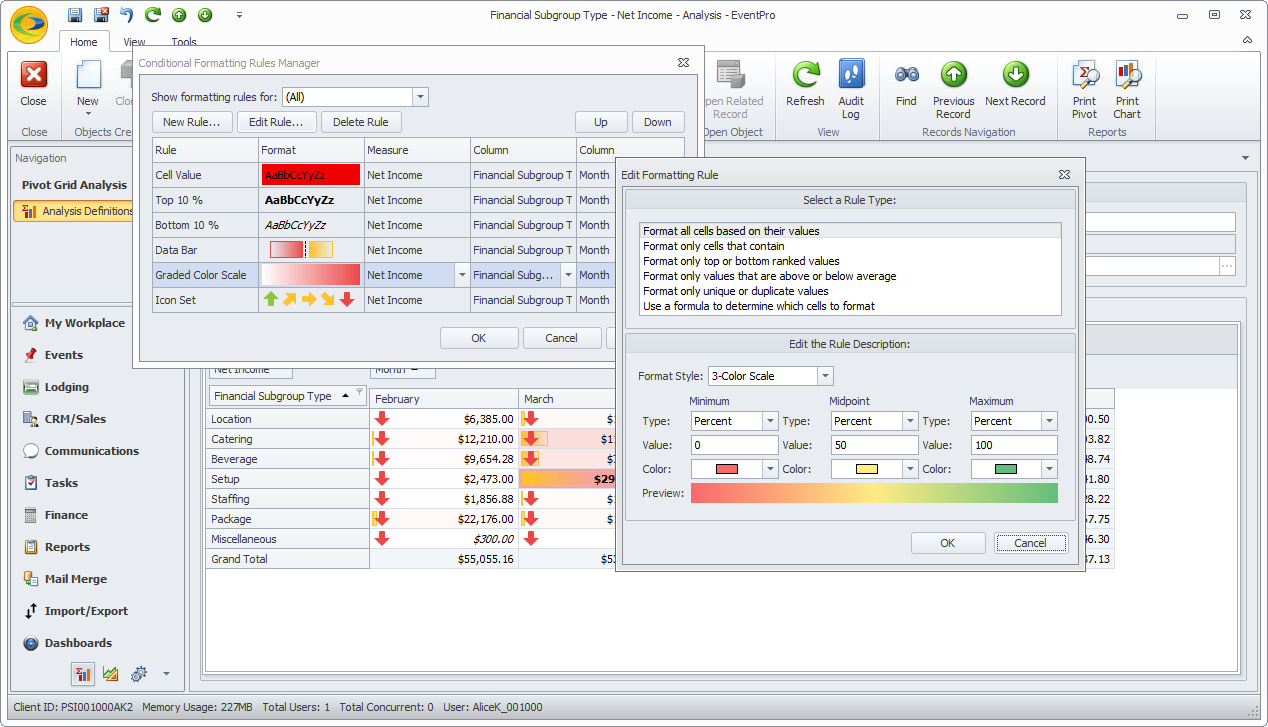
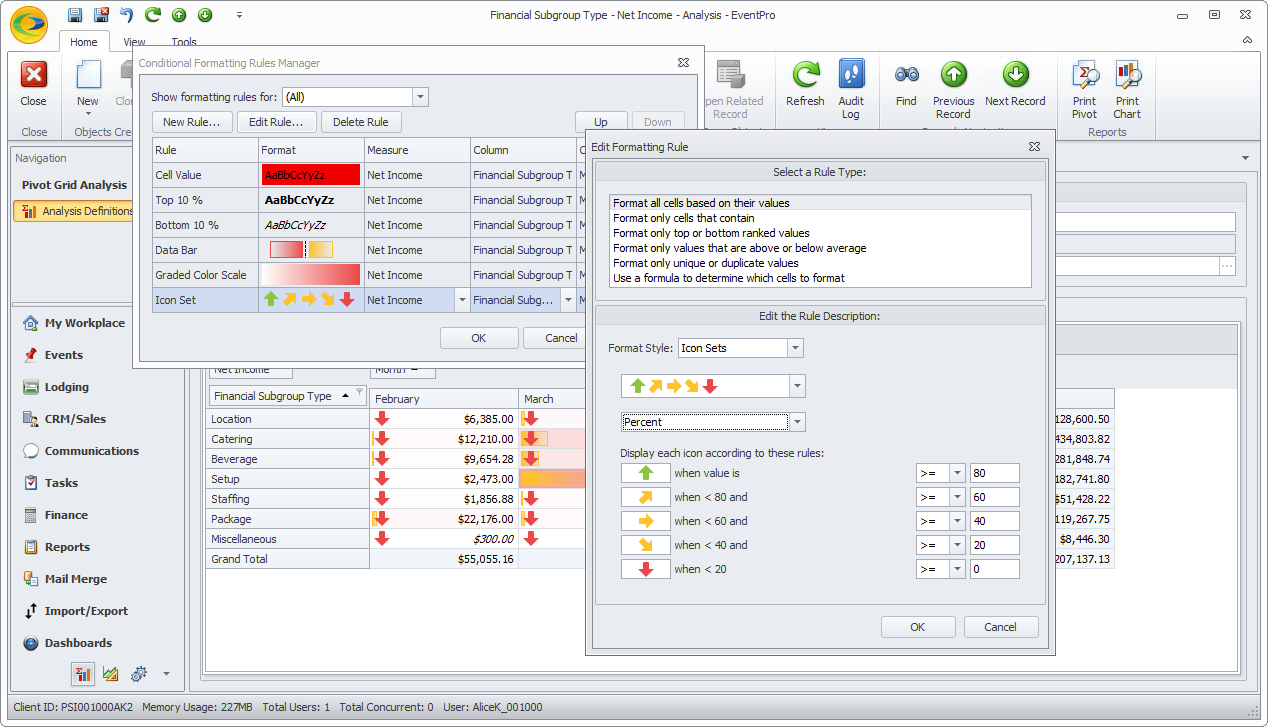
When you initially apply conditional formatting using the Format Rules function, you will be able to choose from a variety of default options for conditions, font, and fill colors. However, if you want even more customization, you can adjust the specifications for each formatting rule under Manage Rules:
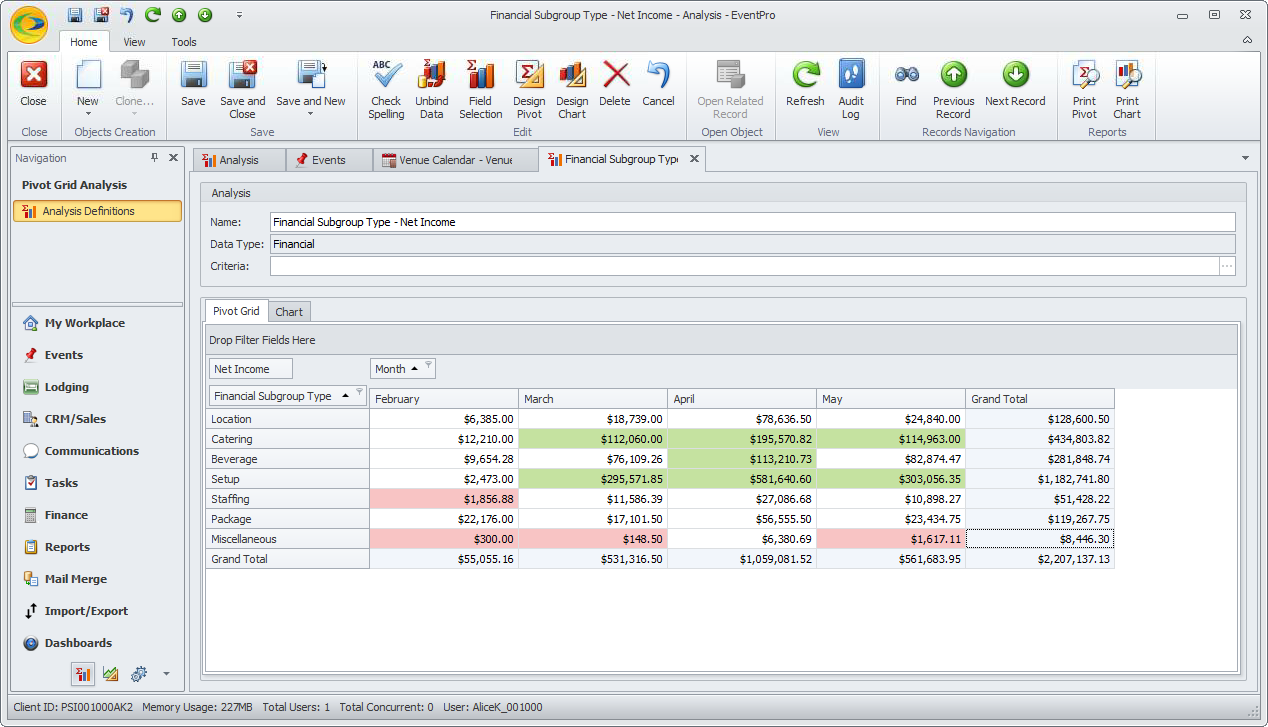
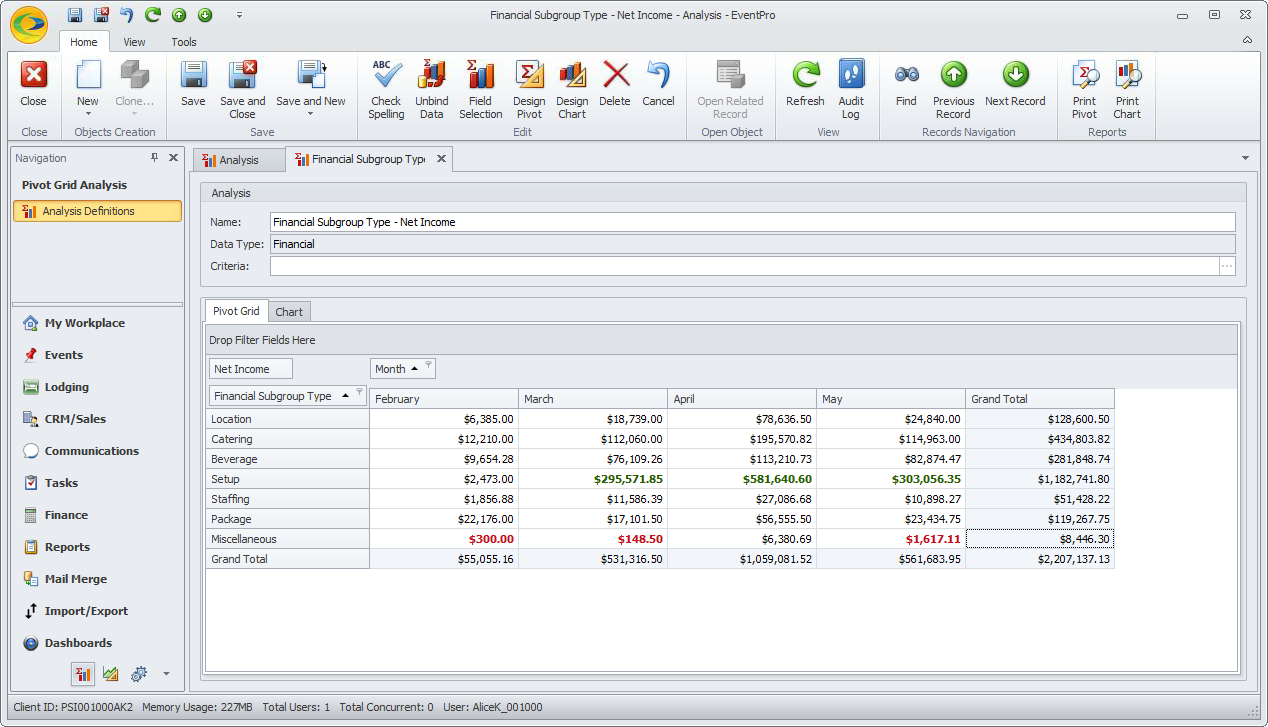
Ensure that you Save your Pivot Grid Analysis, including the conditional formatting you just defined, by clicking the Save or Save and Close button in the top navigation ribbon